
Reselling Performance Insights in the Agency Dashboard
The Location-Level Breakdown widget helps agencies understand how each sub-account contributes to revenue, cost, profit, and margin. Instead of reviewing overall reselling performance only at the agency level, you can compare client performance side by side and quickly identify which locations are profitable, underperforming, or creating revenue leakage. Use this guide to learn how the widget works, how to review location-level metrics, and how to take action from the detailed view.
What is the Location-Level Breakdown Widget?
The Location-Level Breakdown widget is a reporting widget in the Agency Dashboard’s Reselling area that shows financial performance by sub-account. It helps agencies understand how each location contributes to usage-based reselling performance, including revenue generated, cost incurred, profit, and profit margin.
The widget gives agencies a unified way to compare locations without manually reviewing each client’s usage or billing activity. After identifying a high-performing, low-margin, or loss-making location, you can open the location’s detailed view to review product-level performance, monthly trends, and available reselling configuration options.
Key Benefits of the Location-Level Breakdown Widget.
- Client-Level Profitability Visibility: Compare revenue, cost, profit, and profit margin across sub-accounts in one table.
- Faster Risk Detection: Sort locations by revenue, cost, profit, or margin to find high-cost, low-margin, or loss-making clients.
- Better Revenue Optimization: Identify locations where pricing, markups, or reselling settings may need to be adjusted.
- Reduced Revenue Leakage: Spot sub-accounts where usage costs may not be fully resold or where margins are lower than expected.
- Deeper Performance Analysis: Open a sub-account detail view to review product-level revenue and cost across reselling products.
- Actionable Monthly Trends: Use timeline insights to understand how a location’s revenue, cost, and profitability change over time.
Where to Access the Location-Level Breakdown Widget
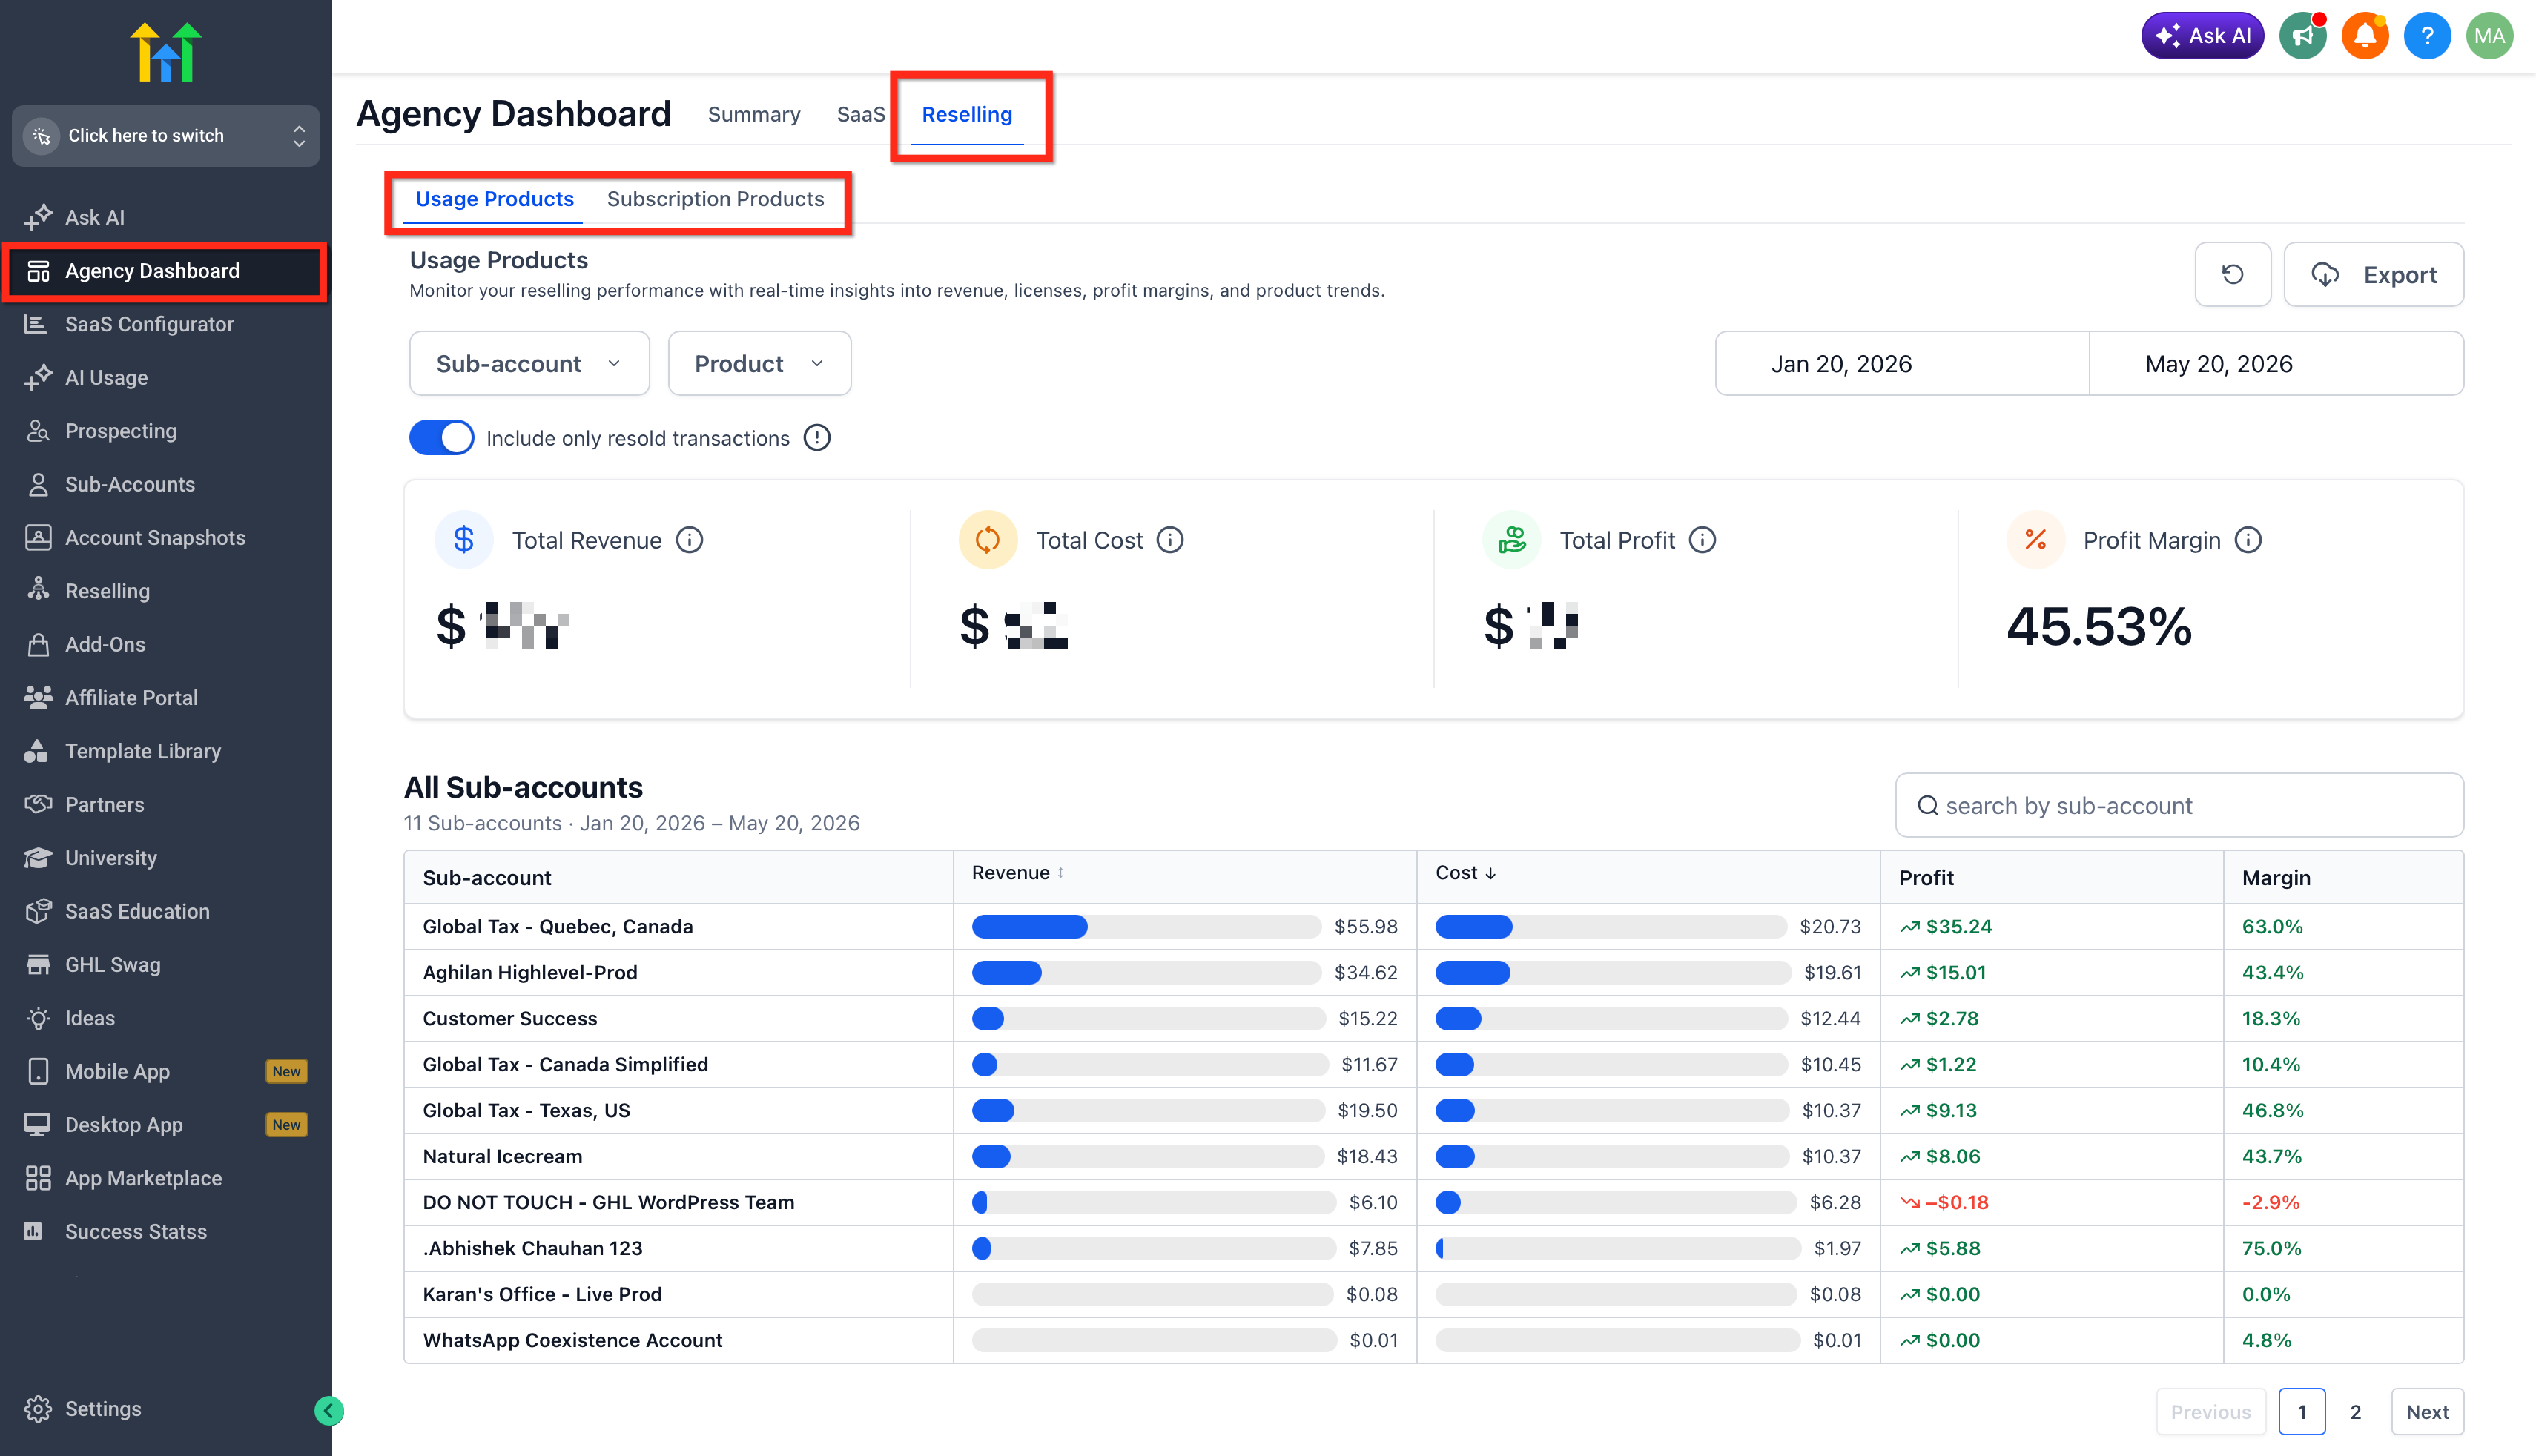
The Location-Level Breakdown widget is available in the Agency Dashboard under the Reselling tab. This location gives agencies one place to review reselling performance, compare sub-account profitability, and drill into location-specific details.
To access the widget:
- Log in to Chat To Clients CRM in Agency View.
- Go to Agency Dashboard.
- Select the Reselling tab.
- Choose Usage Products or Subscription Products, depending on the product type you want to review.
Usage Products and Subscription Products Views
The Reselling tab includes separate views for Usage Products and Subscription Products so agencies can analyze different types of reselling performance. Selecting the correct view helps ensure you are reviewing the right revenue, cost, profit, license, and product trend data before making pricing or configuration decisions.
- Usage Products: Use this view to review usage-based reselling activity, where charges are based on consumption, activity, or usage volume.
- Subscription Products: Use this view to review subscription-based reselling activity, including recurring product performance, licenses, revenue, profit, and product trends.
Usage Product List | Subscription Product List |
|---|---|
Phone | Branded Client Portal App |
Email | Prospecting |
Premium Triggers & Actions | Listings |
Chat To Clients Email Verification | Marketplace App |
Content AI | Whatsapp |
Workflow - External AI Models | Wordpress |
Conversation and Voice AI | AI Employee |
Whatsapp | Workflow Pro |
Reviews AI | Email IP |
Domain Purchase | Ad Manager |
Funnel AI | SEO |
Agent Studio | Conversations AI |
How Filters Affect the Location-Level Breakdown Widget
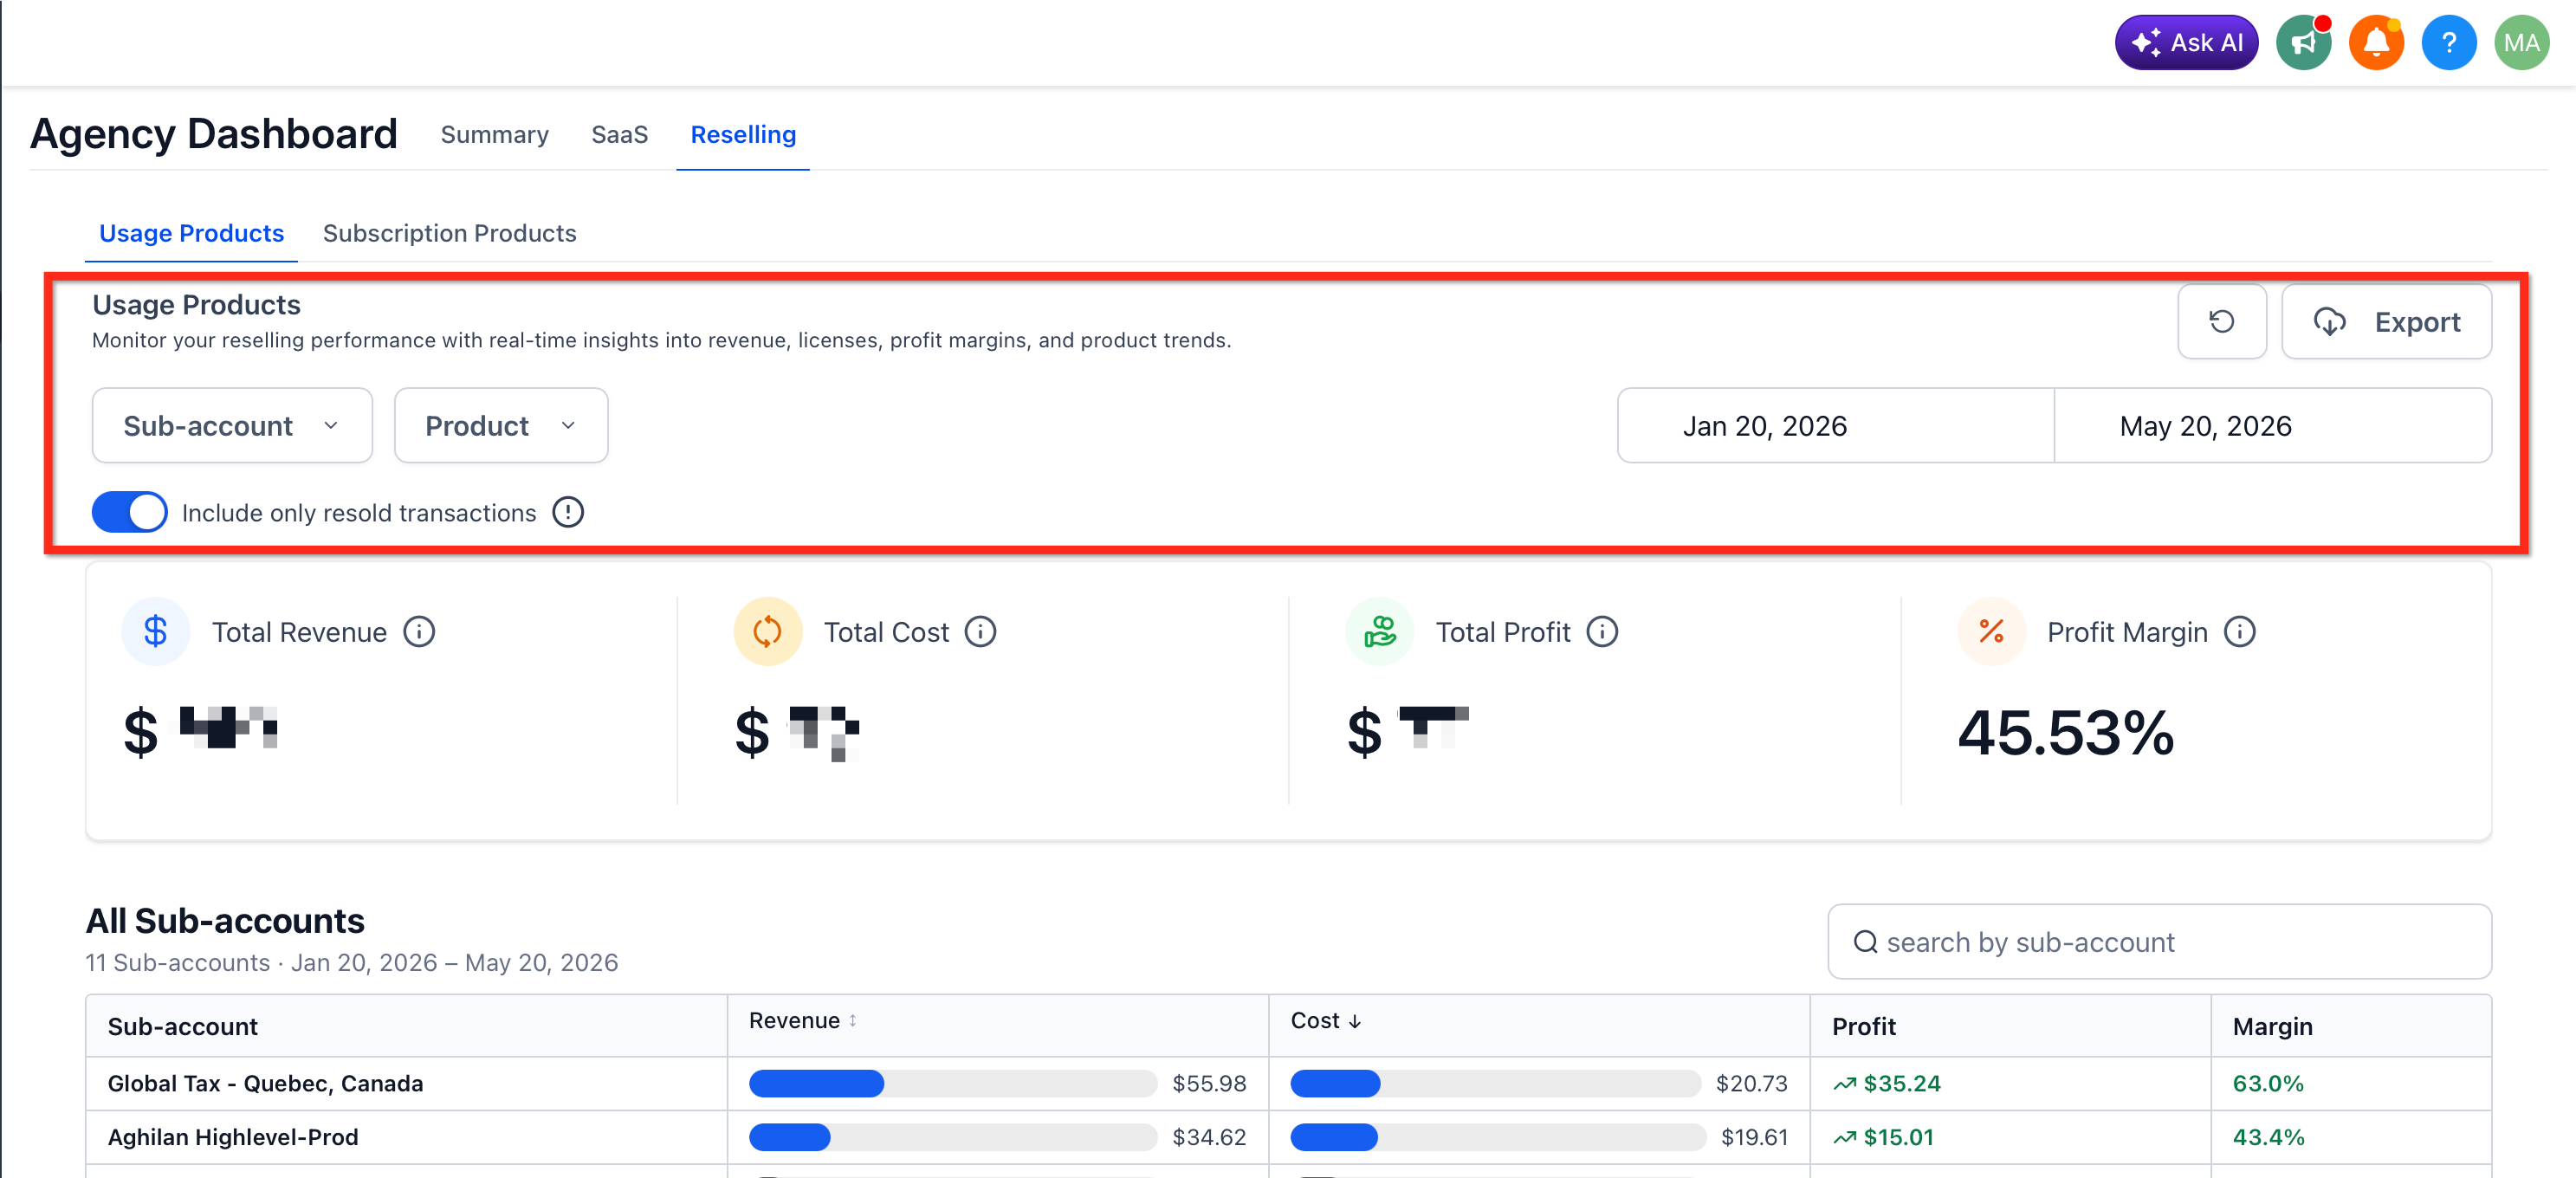
Filters help you focus the widget on the exact data you want to review. Applying the correct filters ensures you are analyzing the right sub-accounts, products, and time period before making pricing or configuration decisions.
Common filters and controls include:
- Sub-Account Filter: Focus reporting on one or more selected locations.
- Product Filter: Review all products or narrow reporting to specific product categories.
- Date Range Filter: Review performance for the selected period.
- Include Only Resold Transactions: Focus reporting on resold transactions when enabled.
- Export: Download the dashboard data CSV file for offline review, reporting, or sharing with your team.
Location-Level Breakdown Metrics
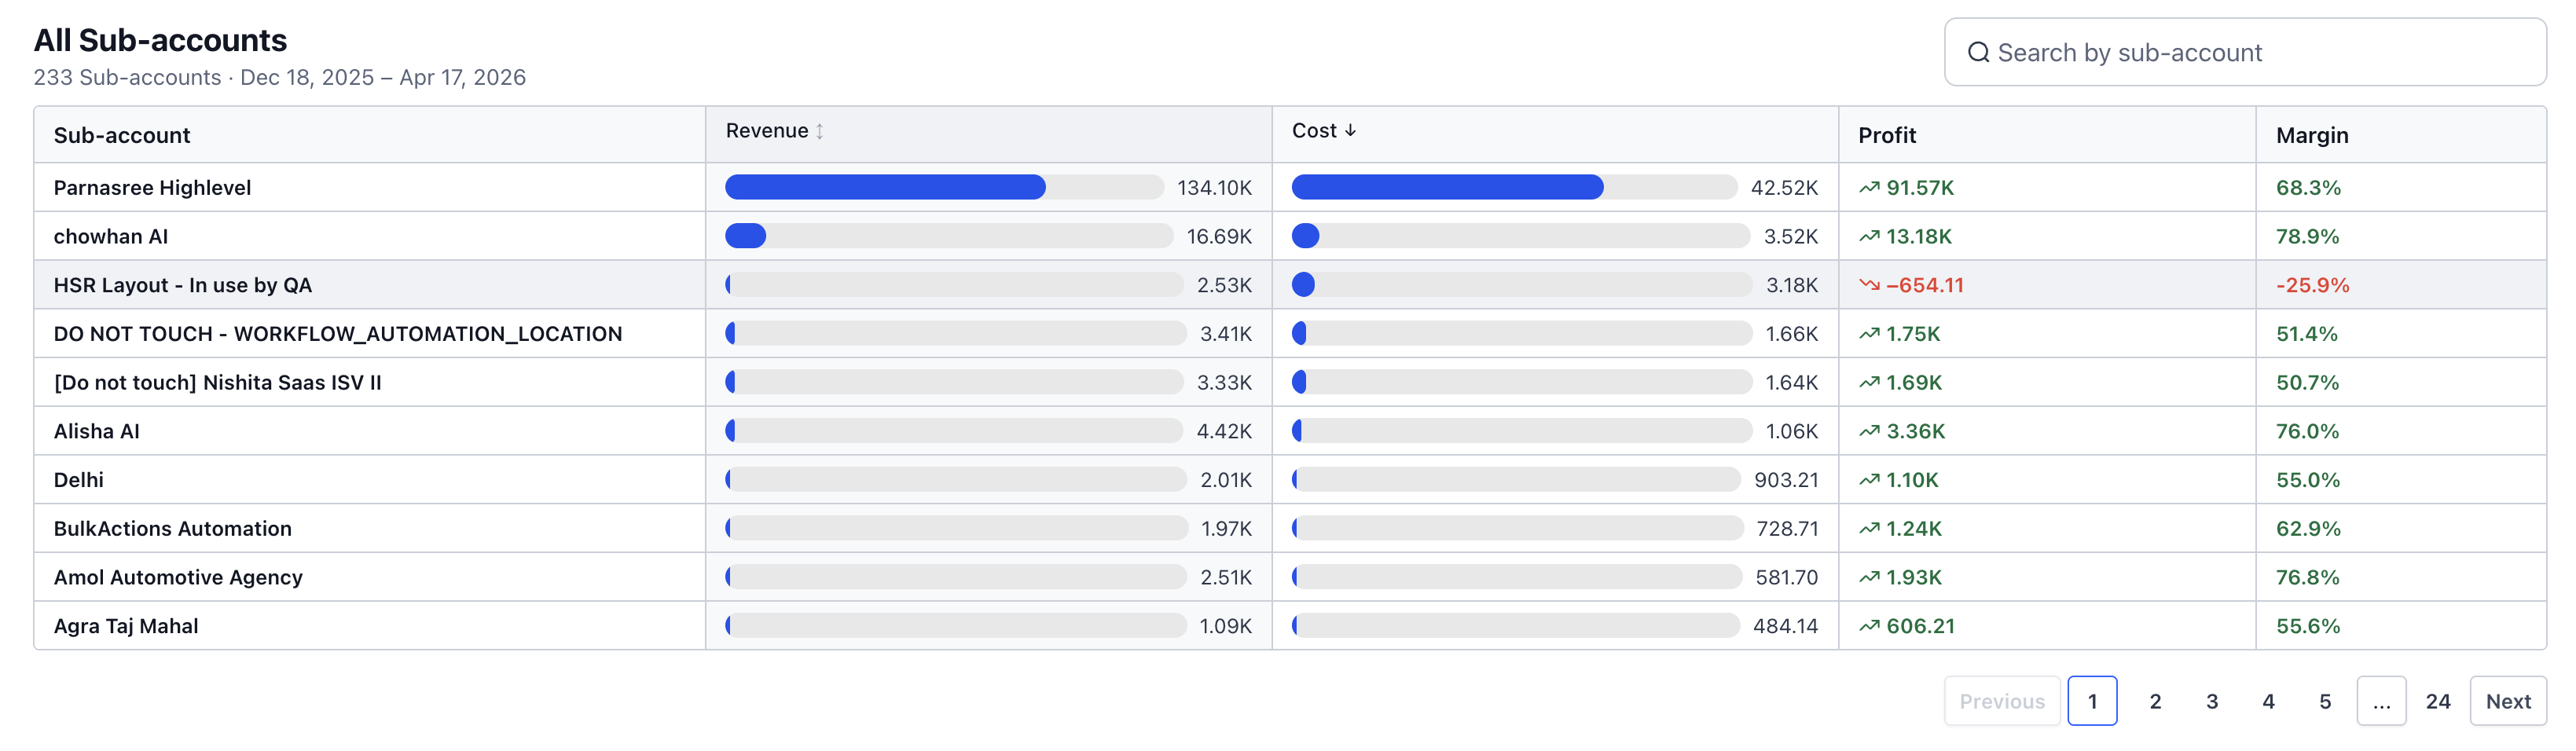
The Location-Level Breakdown table gives agencies a clear financial snapshot of each sub-account. These metrics help you understand whether each location is generating healthy margins or creating costs that need review.
Typical metrics include:
- Location / Sub-Account: The client location included in the selected reporting view.
- Revenue: The amount generated from the sub-account for the selected reporting period.
- Cost: The cost incurred for the sub-account during the selected reporting period.
- Profit: Revenue minus cost for the selected location.
- Profit Margin: Profit shown as a percentage of revenue.
Reselling Dashboard Graphs and Visual Insights
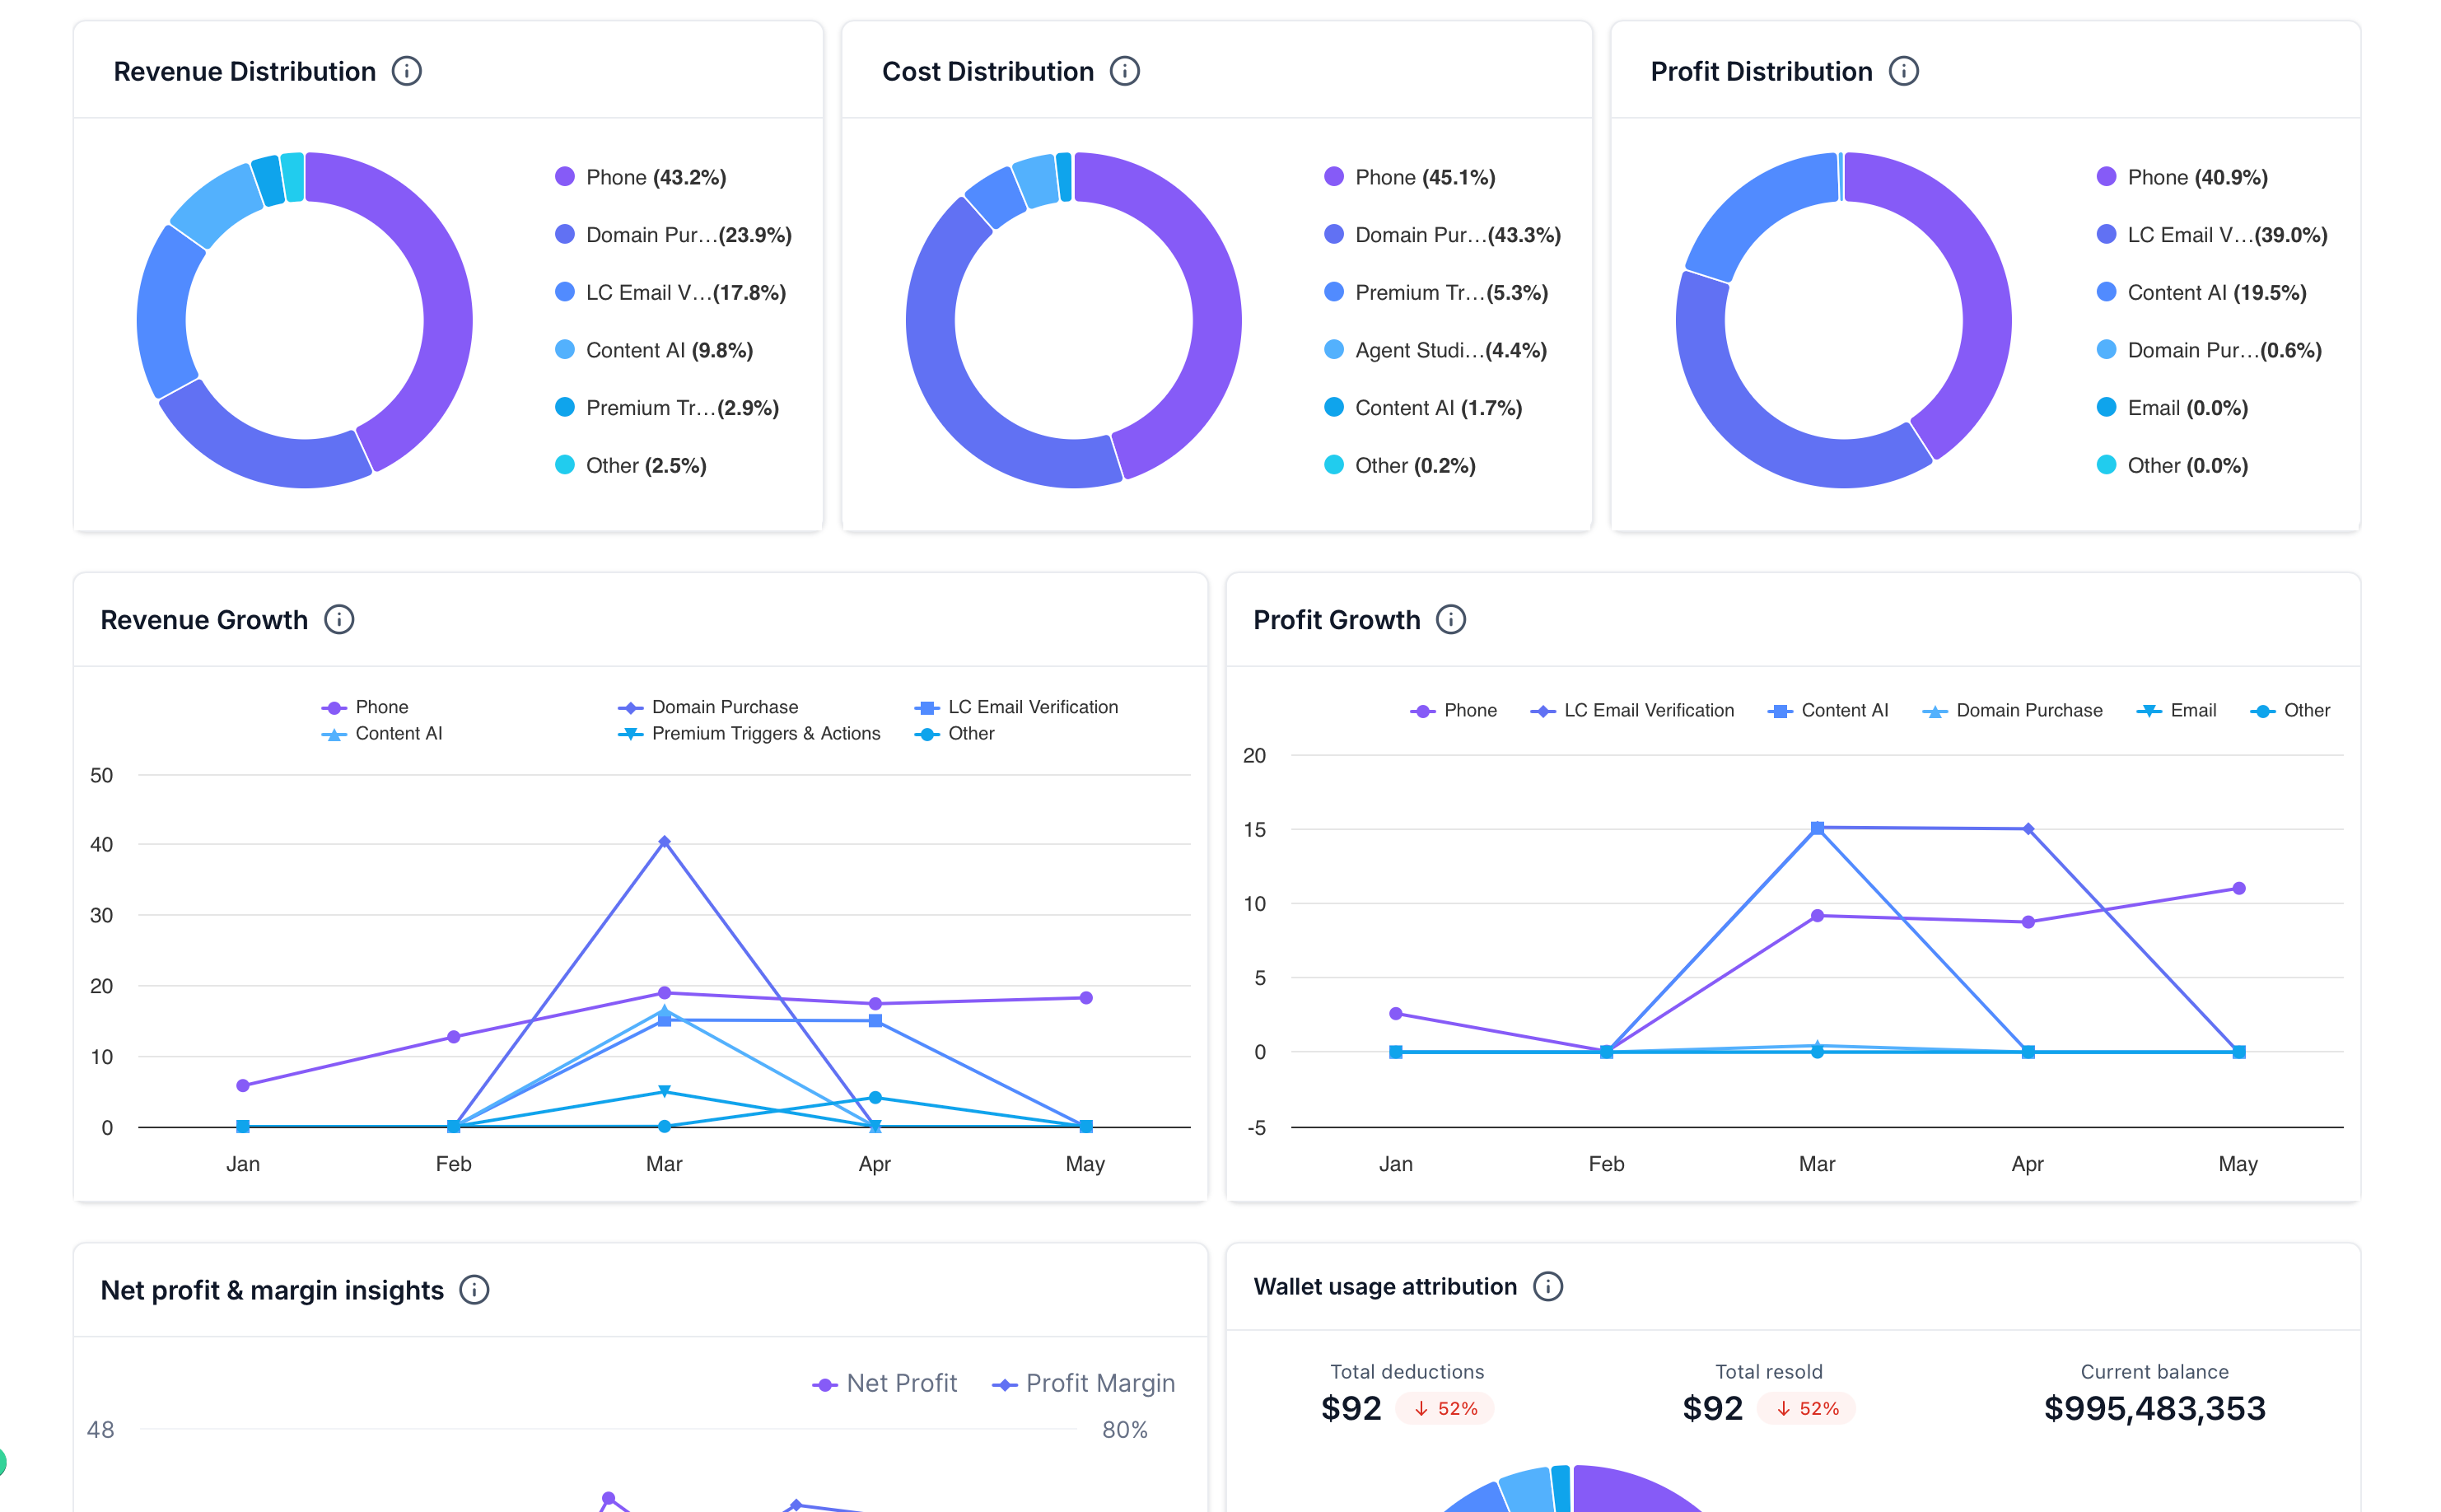
The Reselling dashboard includes visual reporting widgets that help agencies quickly understand how revenue, cost, profit, wallet usage, and growth trends are distributed across products. These graphs make it easier to identify which services are driving revenue, which products are creating the most cost, and whether profitability is improving or declining over time.
Common graph widgets include:
- Revenue Distribution: Shows how total revenue is distributed across reselling products, helping you identify which products contribute the most revenue.
- Cost Distribution: Shows which products account for the largest share of usage or vendor costs.
- Profit Distribution: Shows which products contribute most to overall profit.
- Revenue Growth: Displays revenue trends over time by product, helping you monitor month-over-month growth patterns.
- Profit Growth: Displays how profit changes over time by product, making it easier to identify improving or declining profitability.
- Net Profit & Margin Insights: Compares net profit and profit margin trends over time so you can evaluate whether growth is producing healthy margins.
- Wallet Usage Attribution: Shows wallet-related activity such as total deductions, total resold amount, current balance, and how wallet usage is distributed across products.
Updating Reselling Configurations from the Detail View
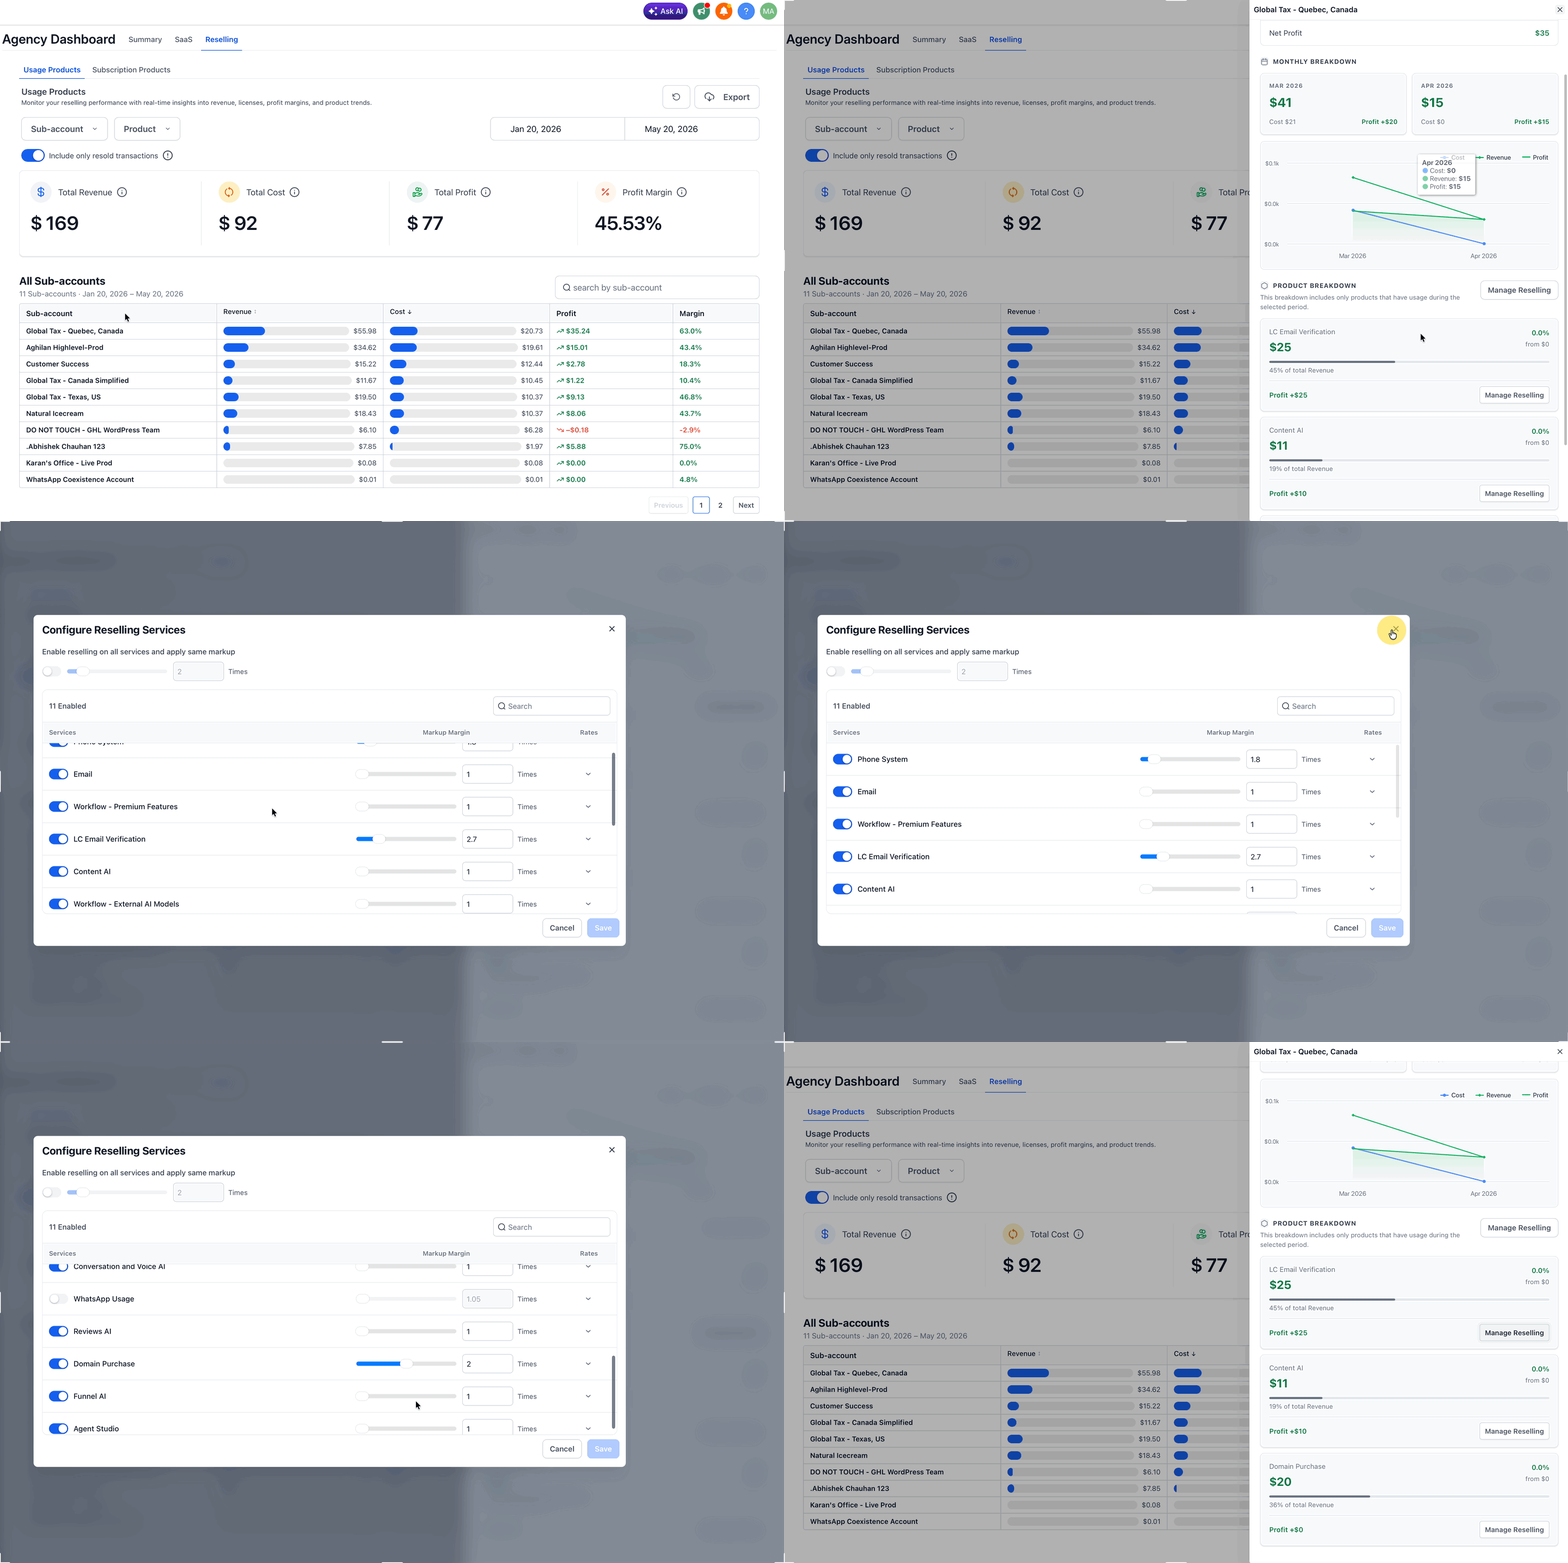
The detailed view is designed to help agencies act on profitability insights without leaving the reporting workflow. After identifying a low-margin or loss-making location, you can review the available configuration options and make adjustments where supported.
Depending on the product and your agency’s setup, you may be able to adjust:
- Pricing or markup settings
- Reselling configuration
- Product-level reselling settings
- Client-specific setup related to usage-based services
Frequently Asked Questions
Q: What is the difference between Usage Products and Subscription Products?
Usage Products are based on consumption or activity, while Subscription Products are recurring resold products that may include license, revenue, profit, and product trend reporting.
Q: What does the Location-Level Breakdown widget show?
It shows a location-level table of sub-accounts with financial metrics such as revenue, cost, profit, and profit margin.
Q: What happens when I click a sub-account?
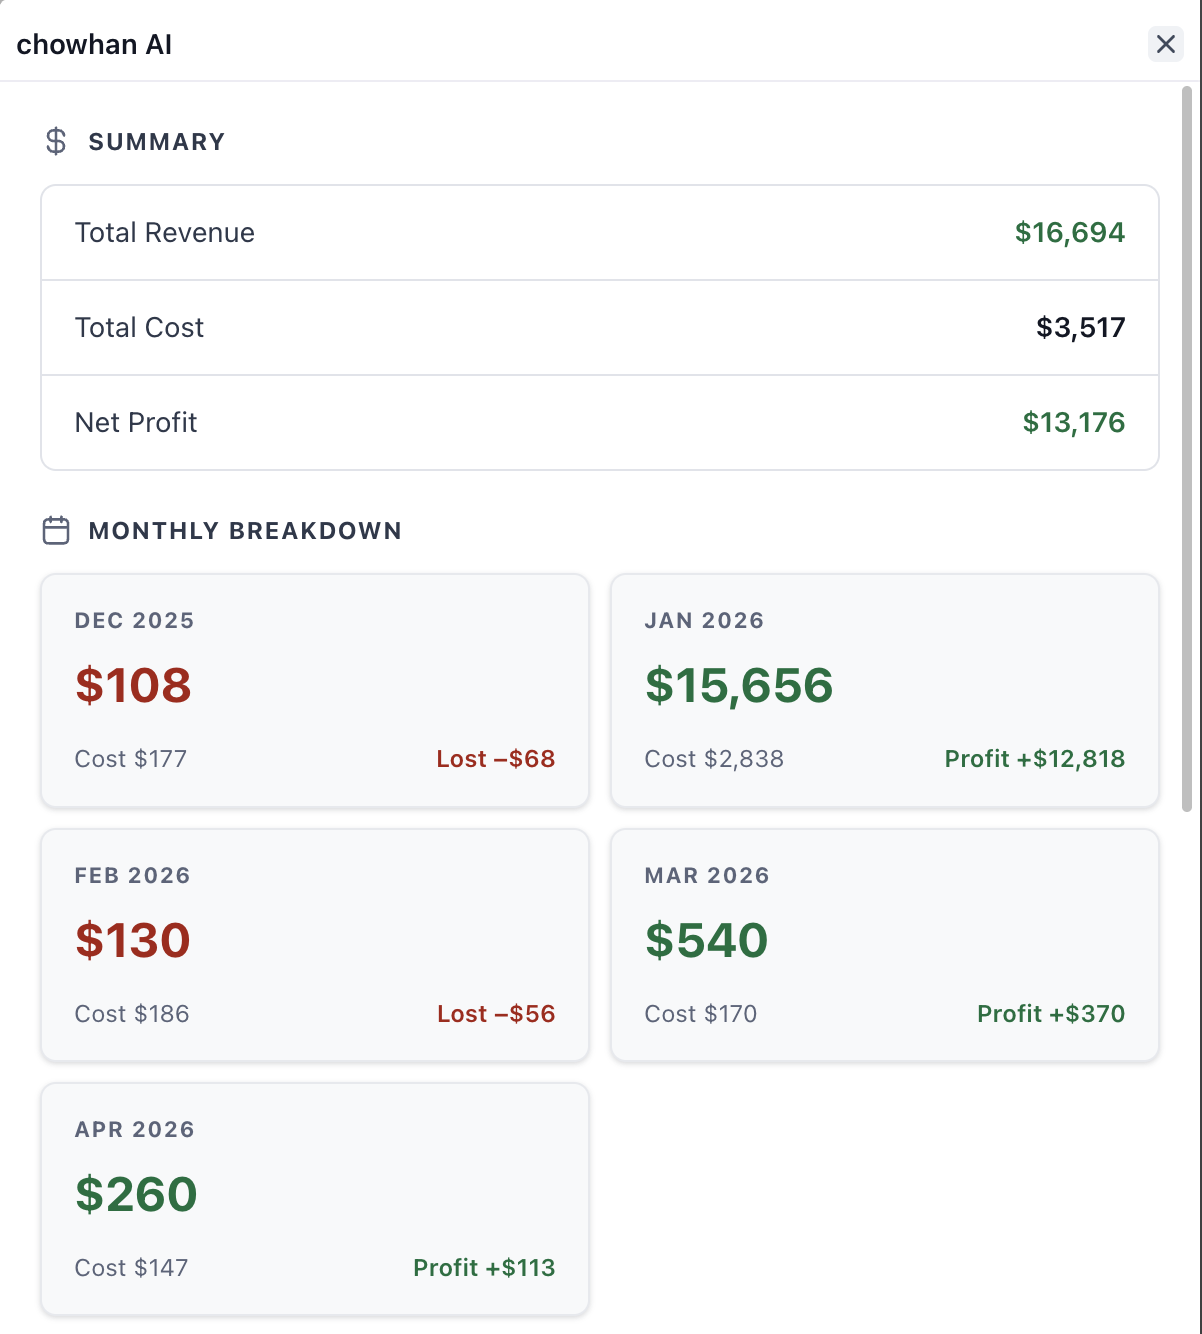
Clicking a sub-account opens a detailed performance view where you can review product-level revenue and cost, timeline insights, and profitability metrics.
Q: What do the dashboard graphs show?
The graphs show product-level revenue distribution, cost distribution, profit distribution, revenue growth, profit growth, net profit and margin trends, and wallet usage attribution.
Q: Can I update reselling settings from the detail view?
Yes. The detailed view includes options to update reselling configurations so agencies can act on low-margin or loss-making locations.
Q: Why is a sub-account missing from the Location-Level Breakdown table?
A sub-account may not appear if it has no relevant activity for the selected filters or date range.