
Listings Analytics Dashboard
The Online Listings Analytics Dashboard gives you a centralized view of how your business listings are performing across directories. It helps you track visibility, engagement, and user behavior—so you can make informed decisions to improve your local presence.
With real-time insights into impressions, actions, and profile activity, this dashboard enables you to measure performance and optimize your listings strategy effectively.
IMPORTANT: Listings Analytics is currently supported only for listings powered by the Yext engine. Analytics for the Uberall engine is not available at this time.
TABLE OF CONTENTS
- What is the Listings Analytics Dashboard?
- Key Benefits of Online Listings Analytics Dashboard
- Key Metrics & Features
- How to Access the Dashboard
- How to Use the Dashboard Effectively
What is the Listings Analytics Dashboard?
Understanding how customers find and interact with your business online is critical for growth. The Listings Analytics Dashboard provides a performance overview of your business listings across multiple platforms. It consolidates data into a single interface, allowing you to:
- Monitor listing visibility
- Track user engagement (calls, clicks, directions)
- Analyze trends over time
- Identify optimization opportunities
This eliminates the need to manually check multiple directories and helps you maintain a consistent and high-performing online presence.
Key Benefits of Online Listings Analytics Dashboard
Tracking listing performance helps businesses optimize their online presence and improve customer engagement. The Analytics Dashboard provides meaningful insights that support better decision-making and measurable growth.
- Centralised Performance Insights: View all listing performance metrics in one place without needing multiple tools.
- Improved Visibility Tracking: Monitor how often your business appears in search results across directories.
- Actionable Customer Data: Understand how customers interact with your listings through clicks, calls, and direction requests.
- Trend Analysis: Identify patterns over time to evaluate the effectiveness of your marketing efforts.
- Data-Driven Decisions: Use real-time insights to refine your listings and improve conversion rates.
Key Metrics & Features
The dashboard includes the following core metrics:
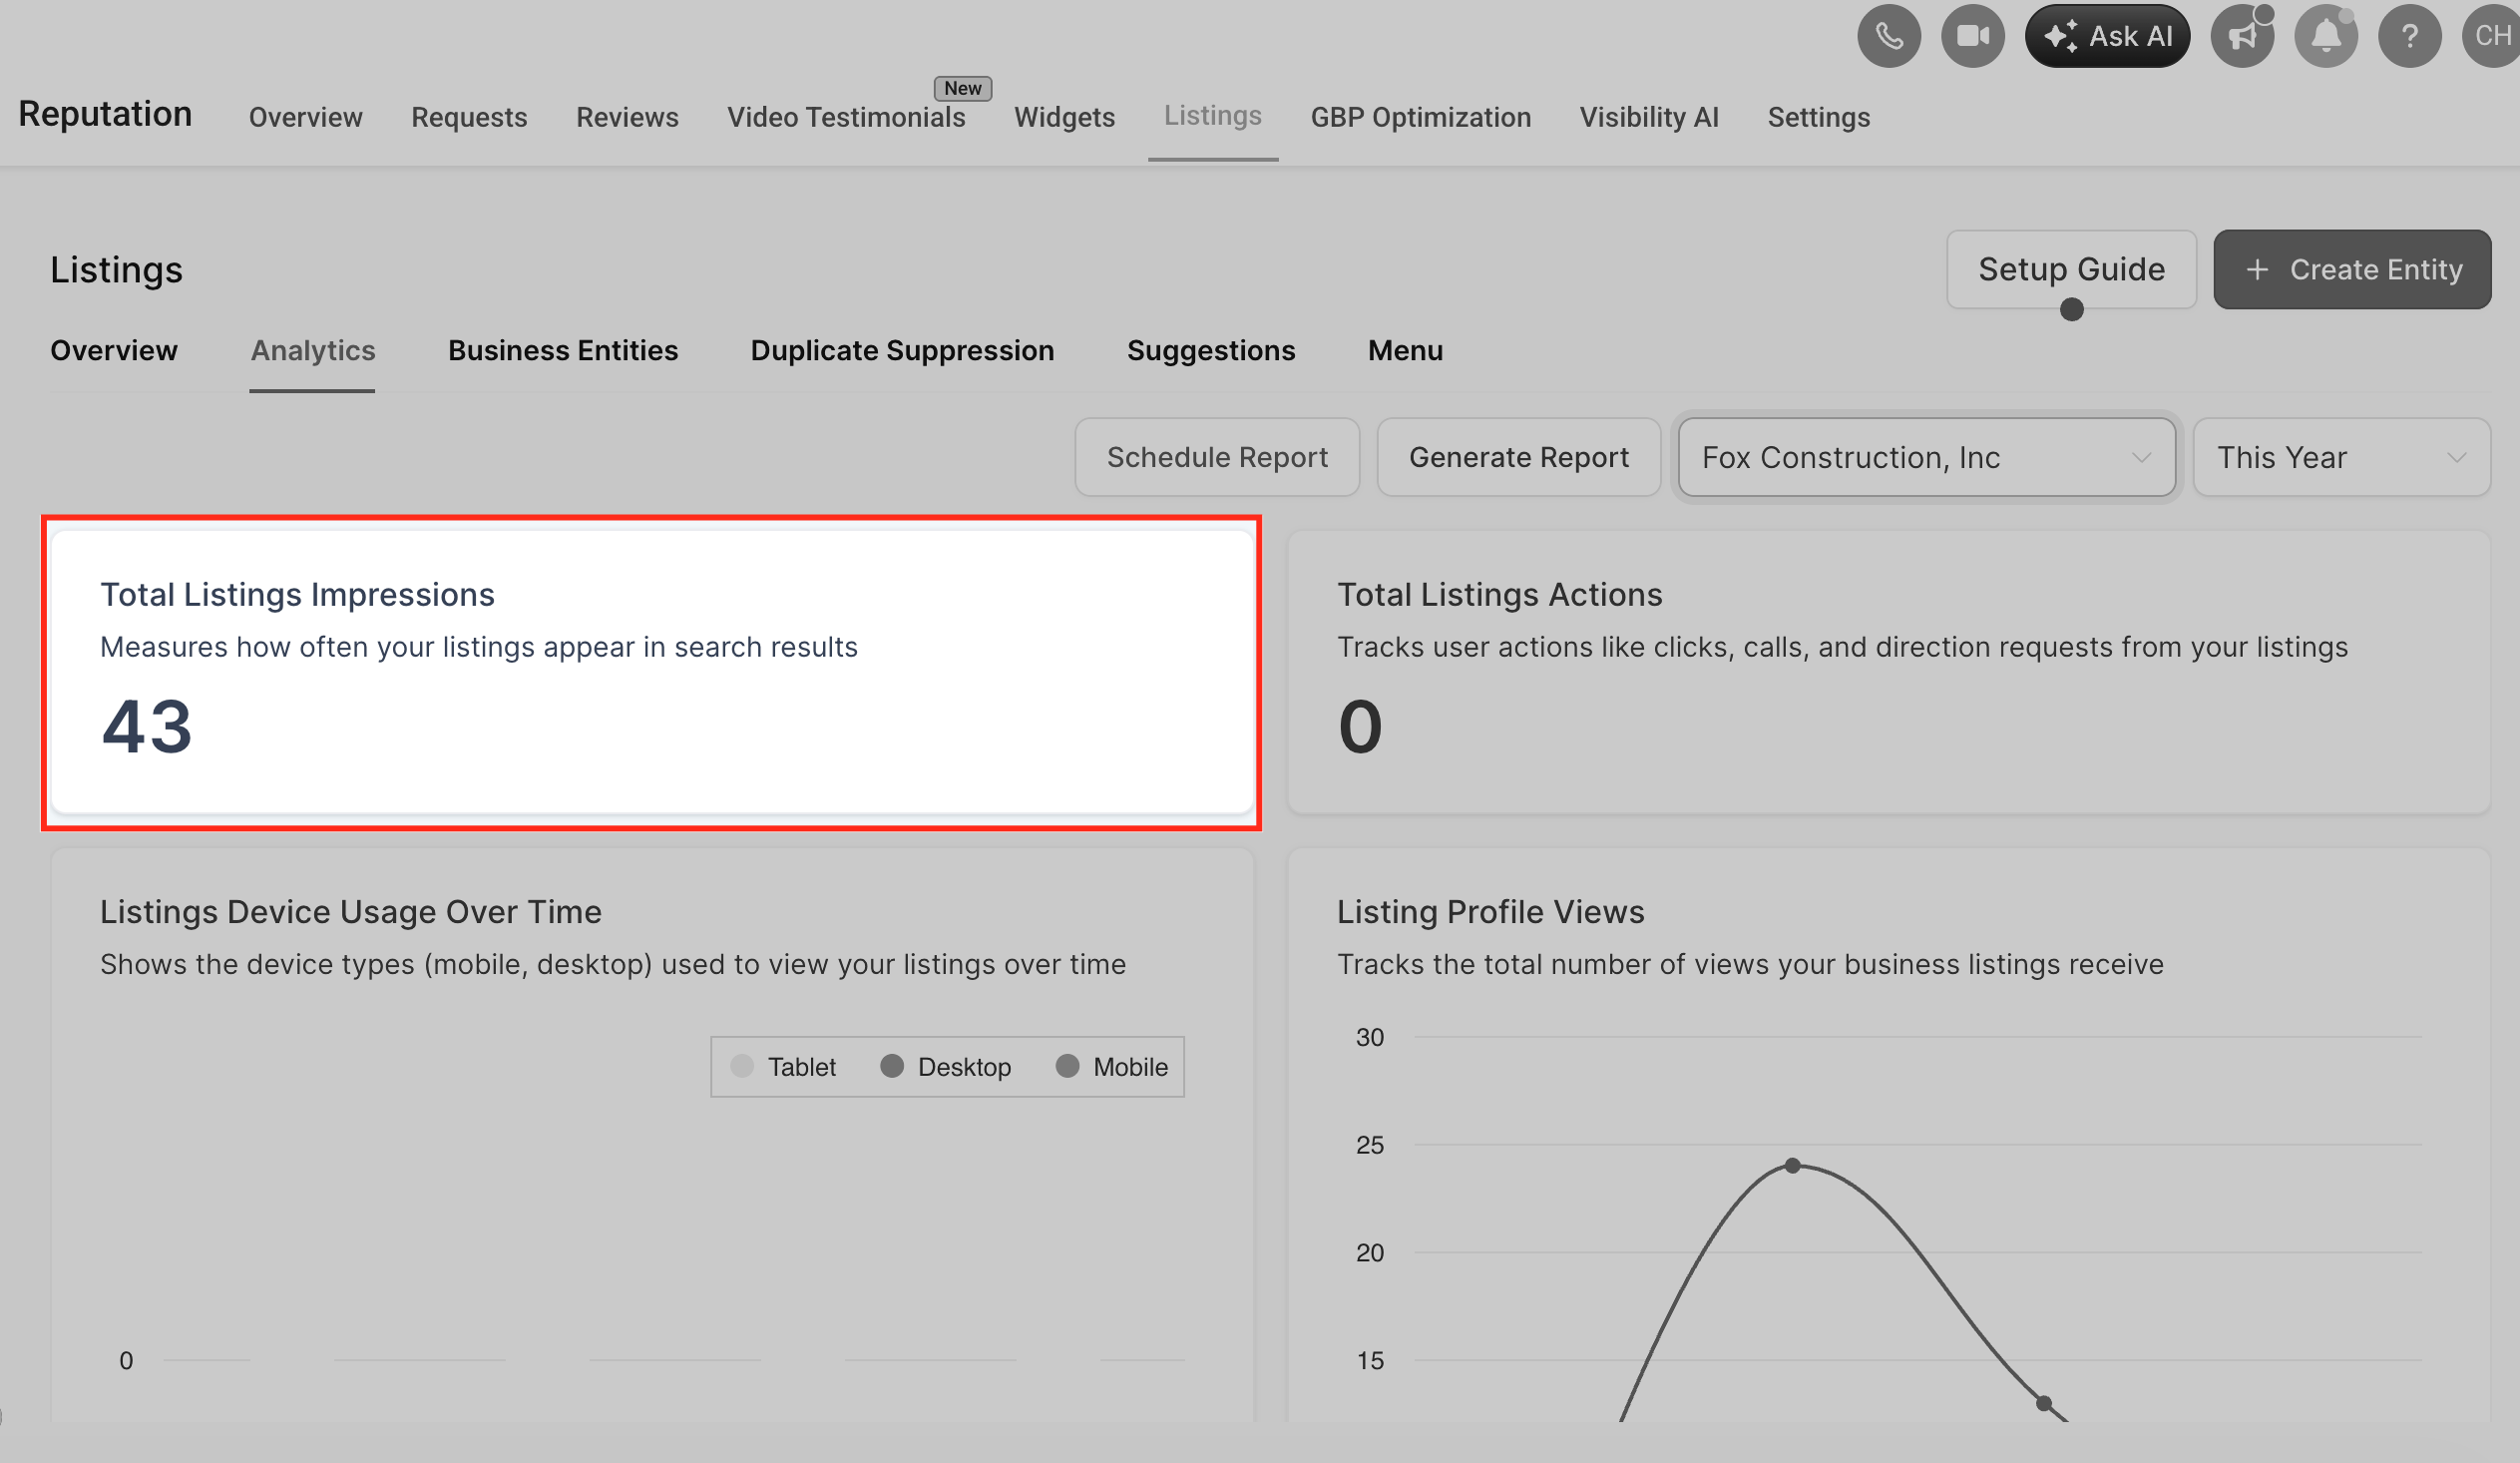
1. Total Listings Impressions
Track how often your listings appear in search results. This helps you understand your visibility across platforms.
2. Total Listings Actions
Measure user interactions such as:
- Clicks
- Calls
- Direction requests
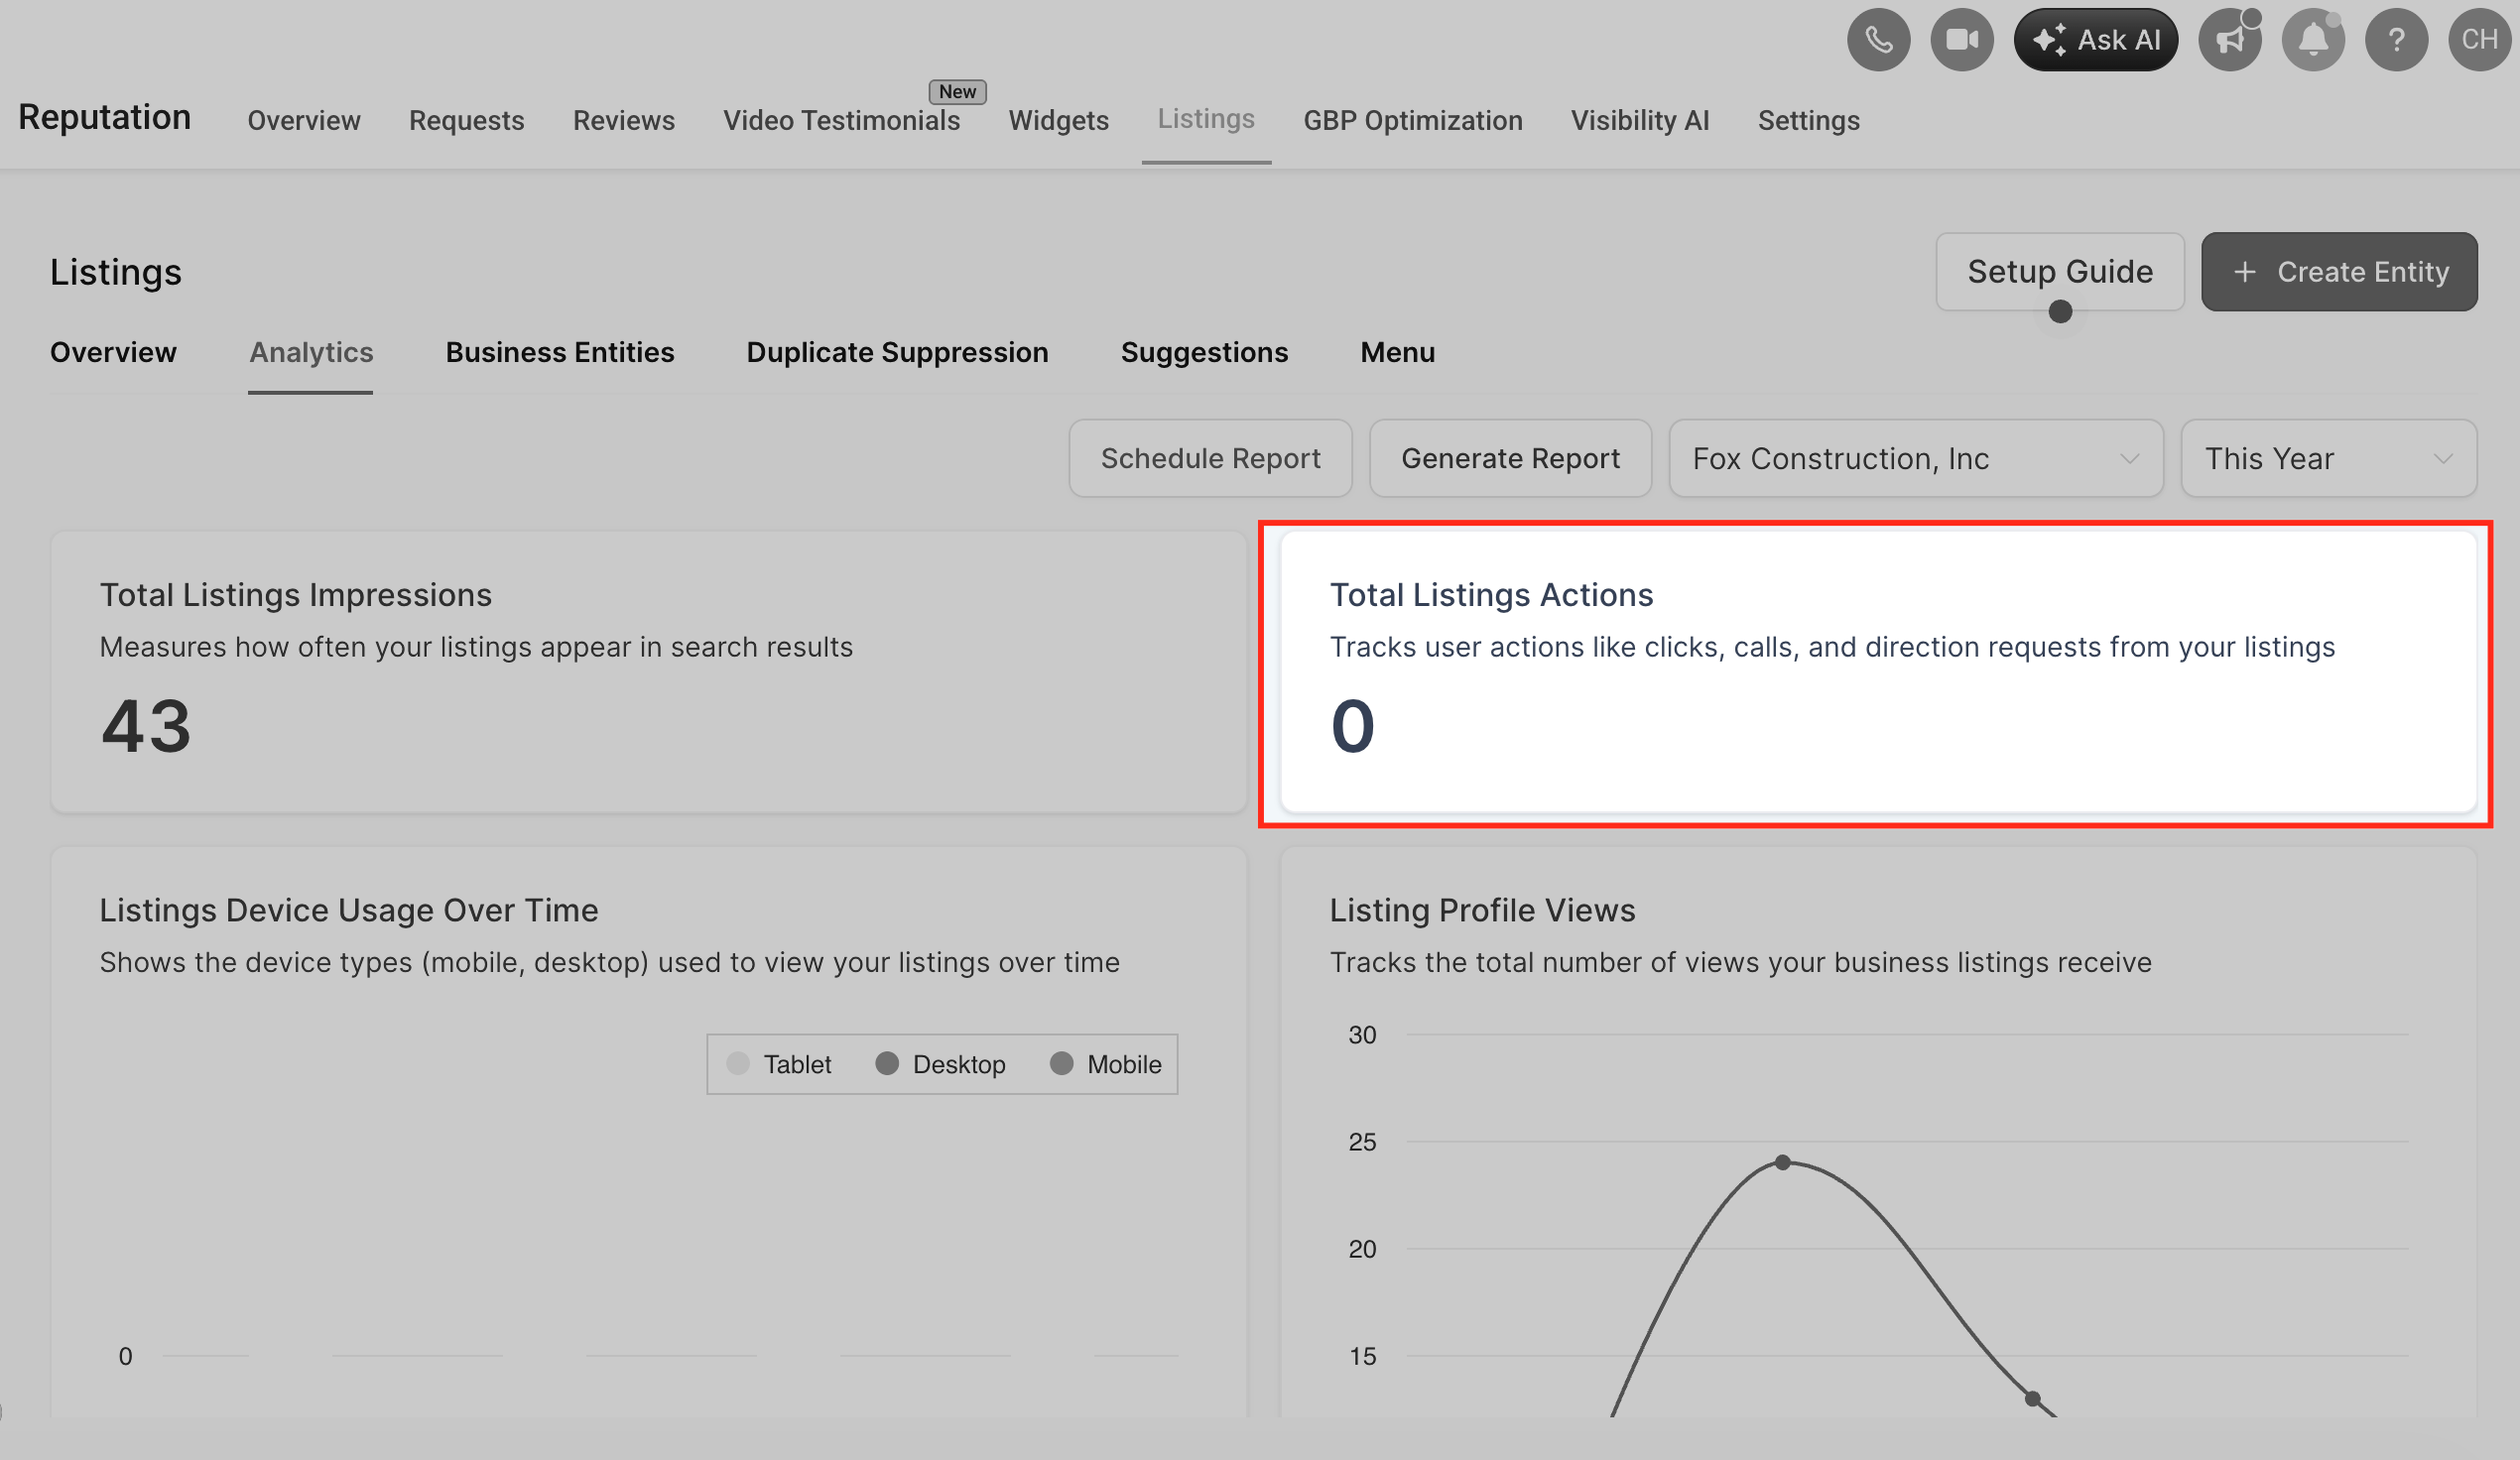
These actions indicate how users engage with your listings.
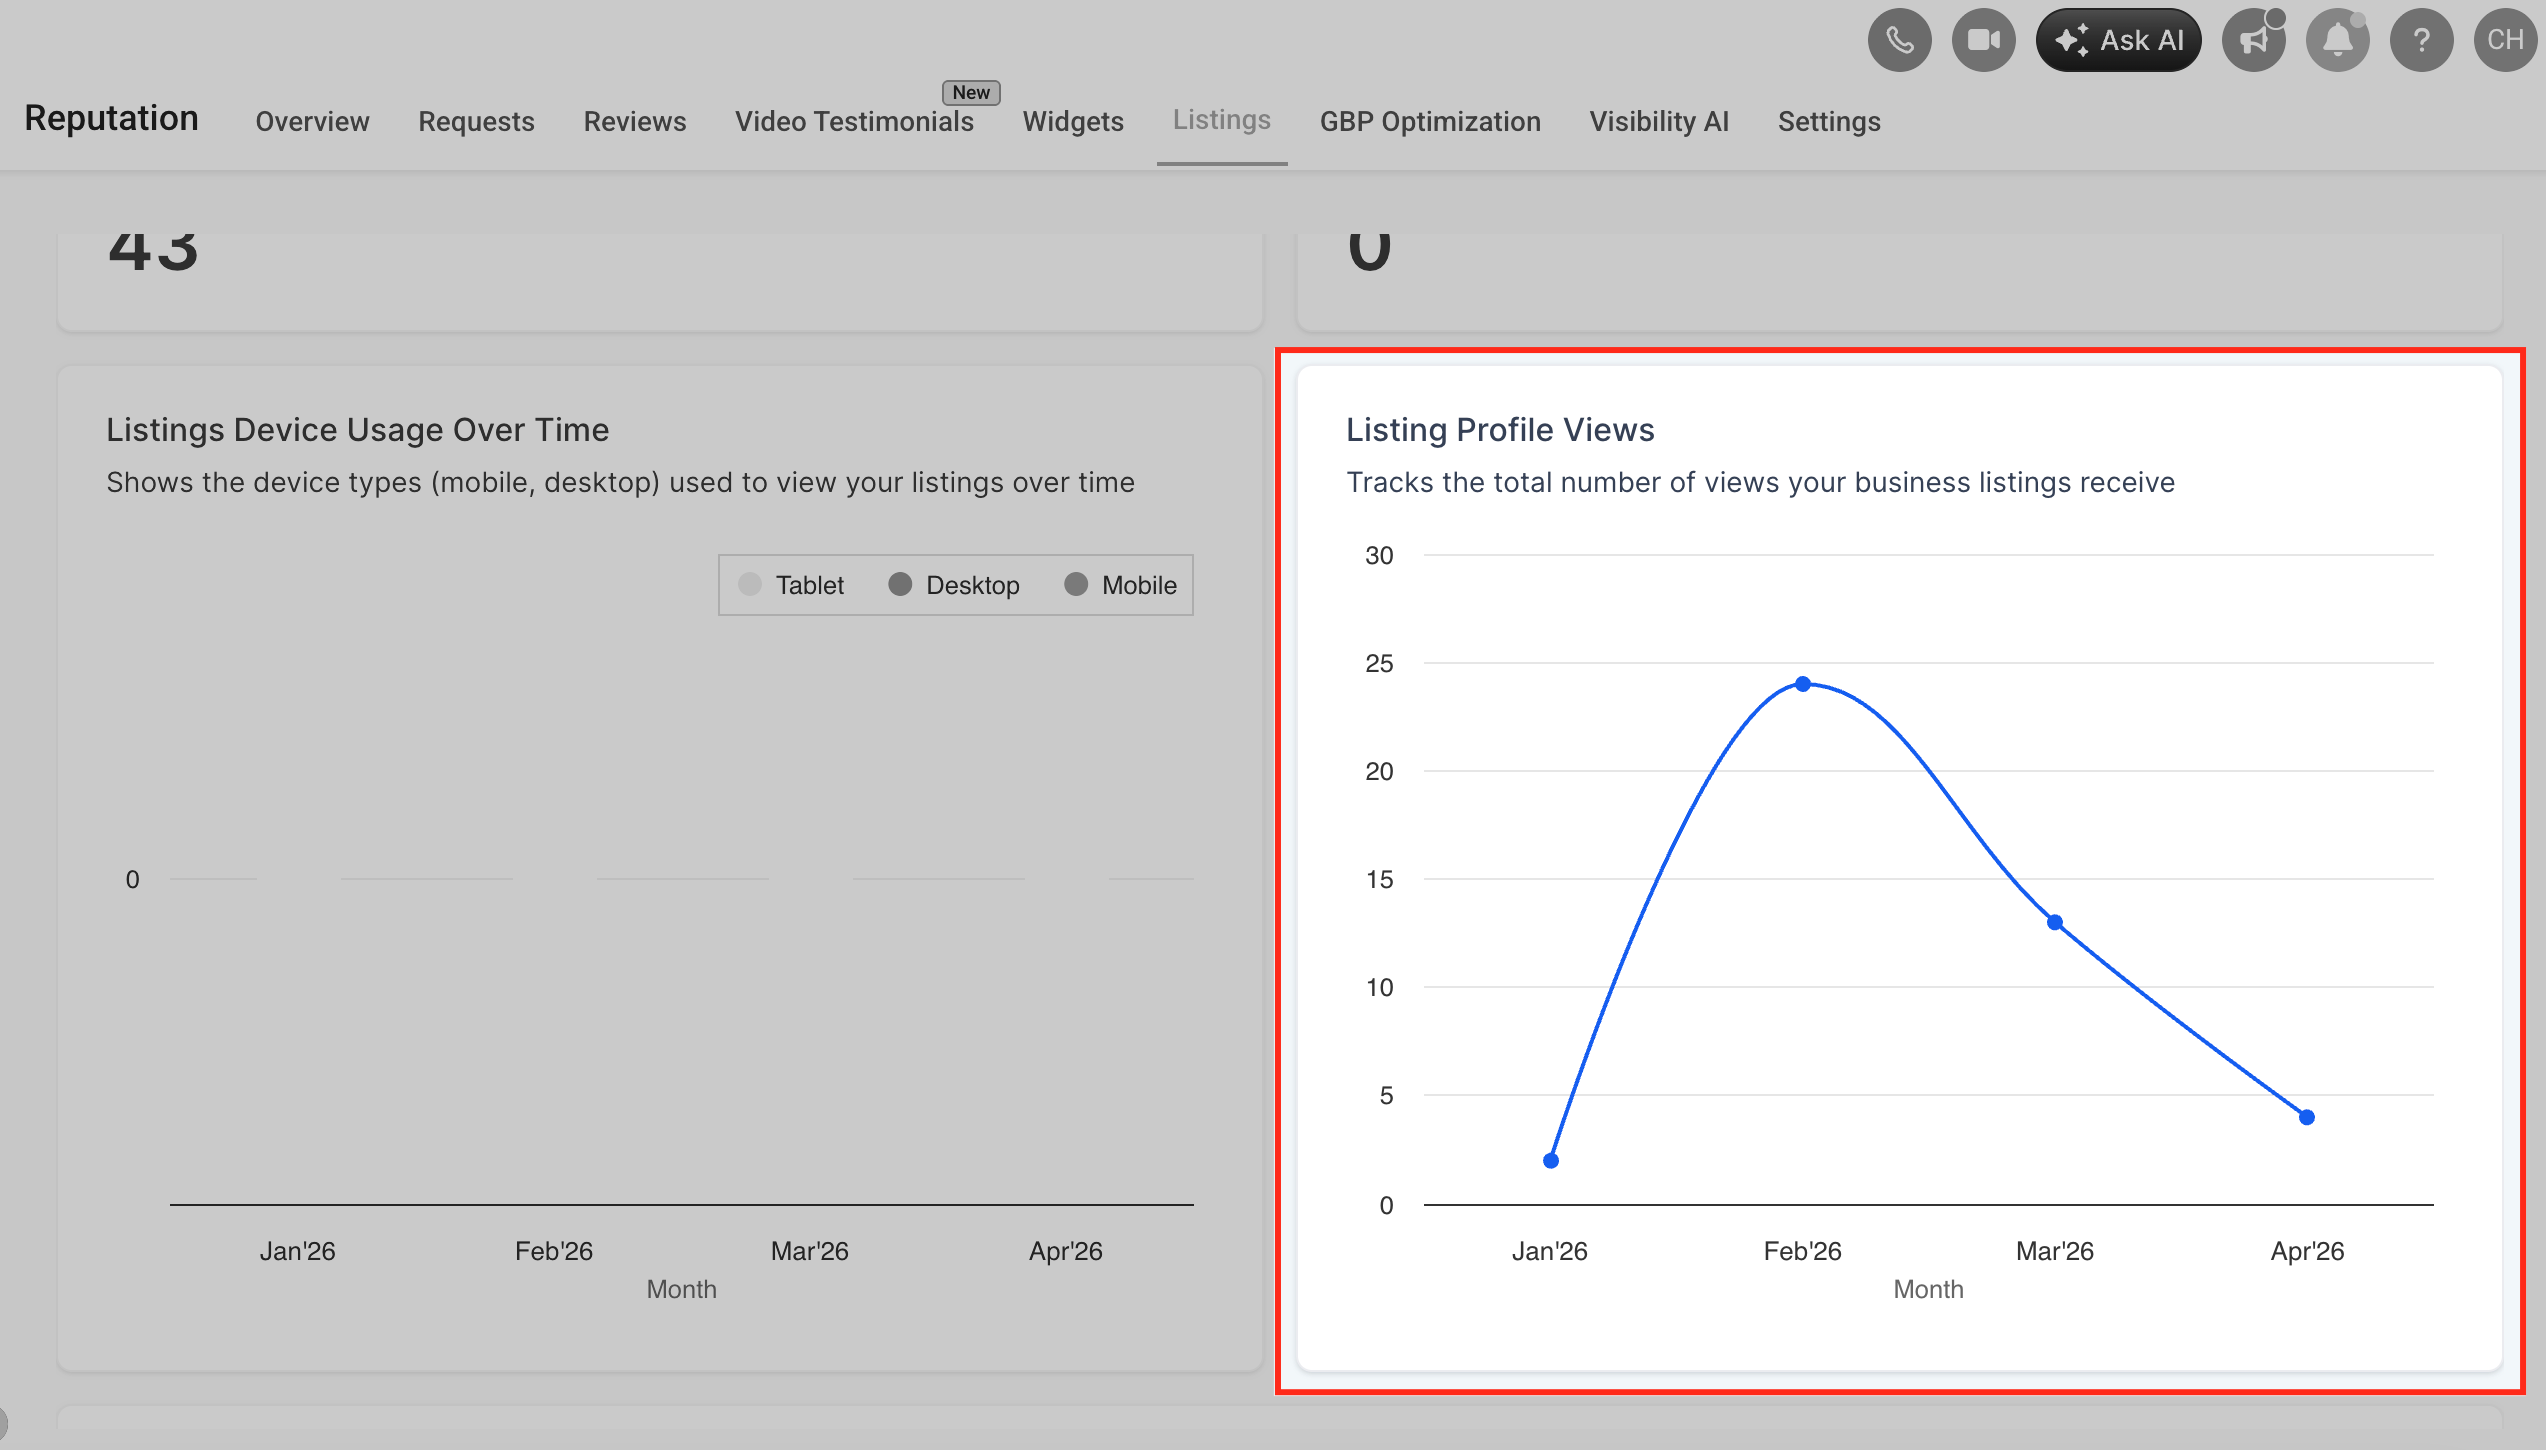
3. Profile Views
See how many users viewed your business profile. This reflects interest in your business.
4. Device Usage Over Time
Understand how users access your listings:
- Mobile
- Desktop
- Tablet
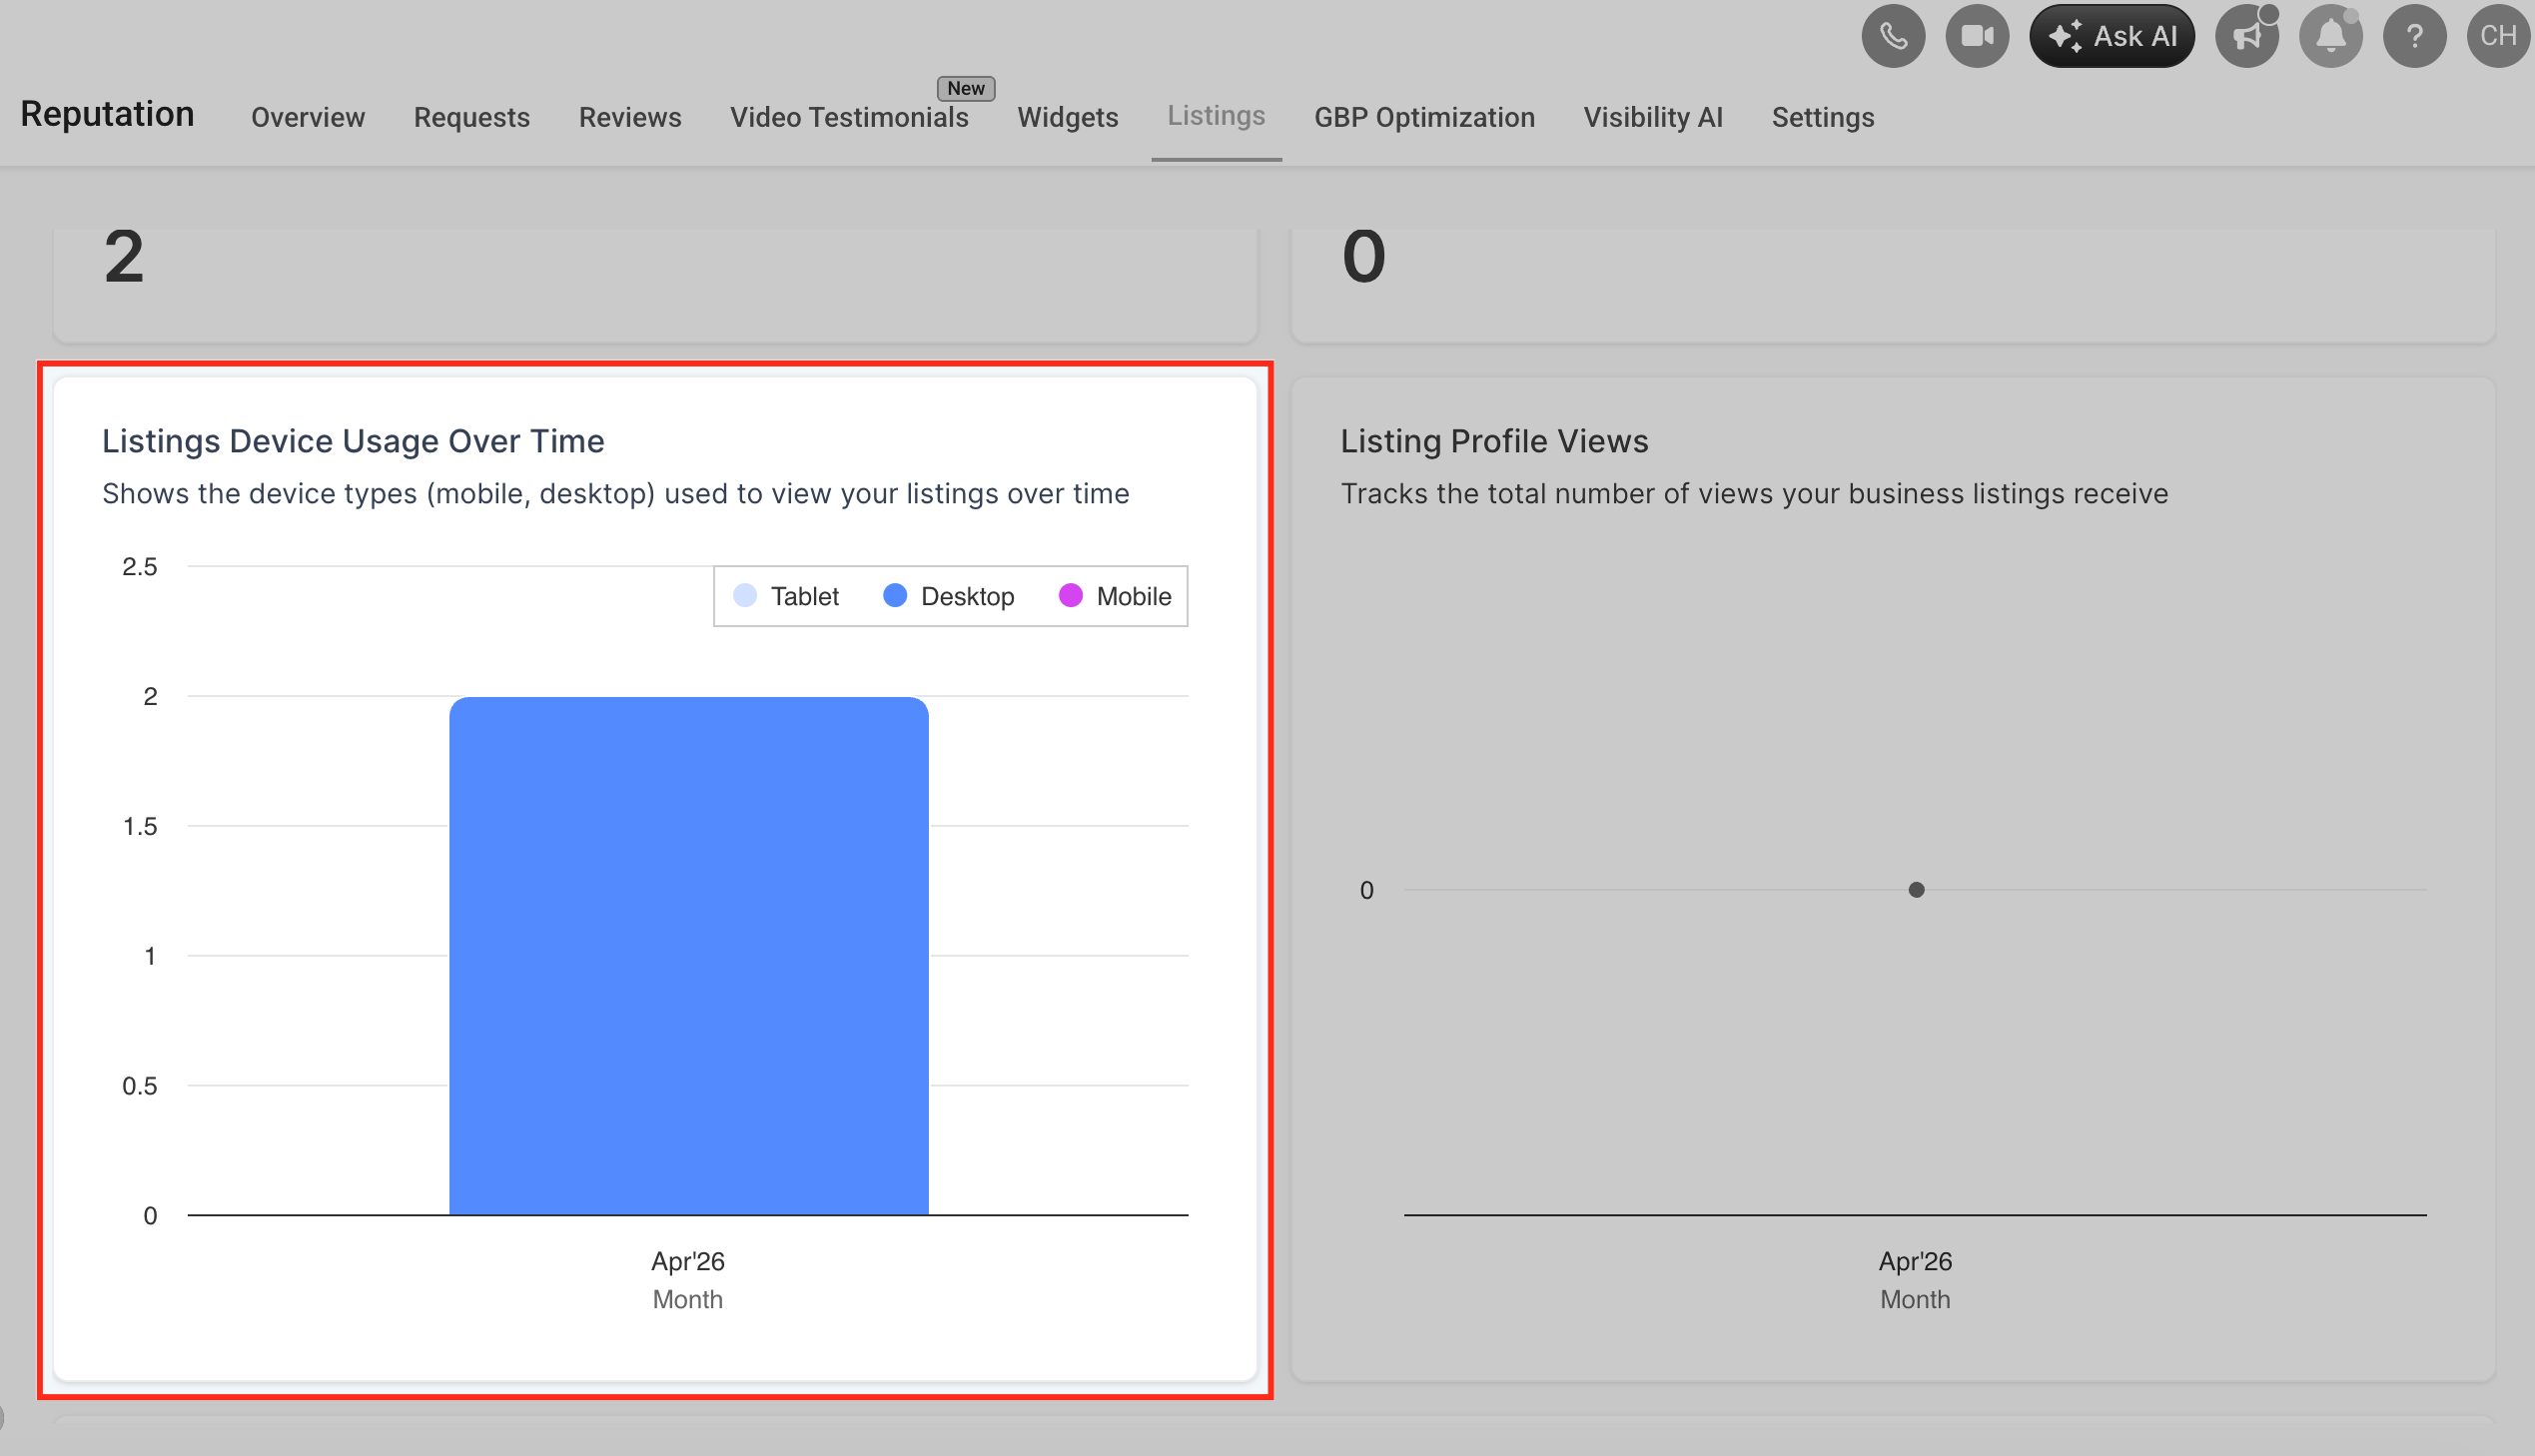
This helps you optimize your listings for the most common devices.
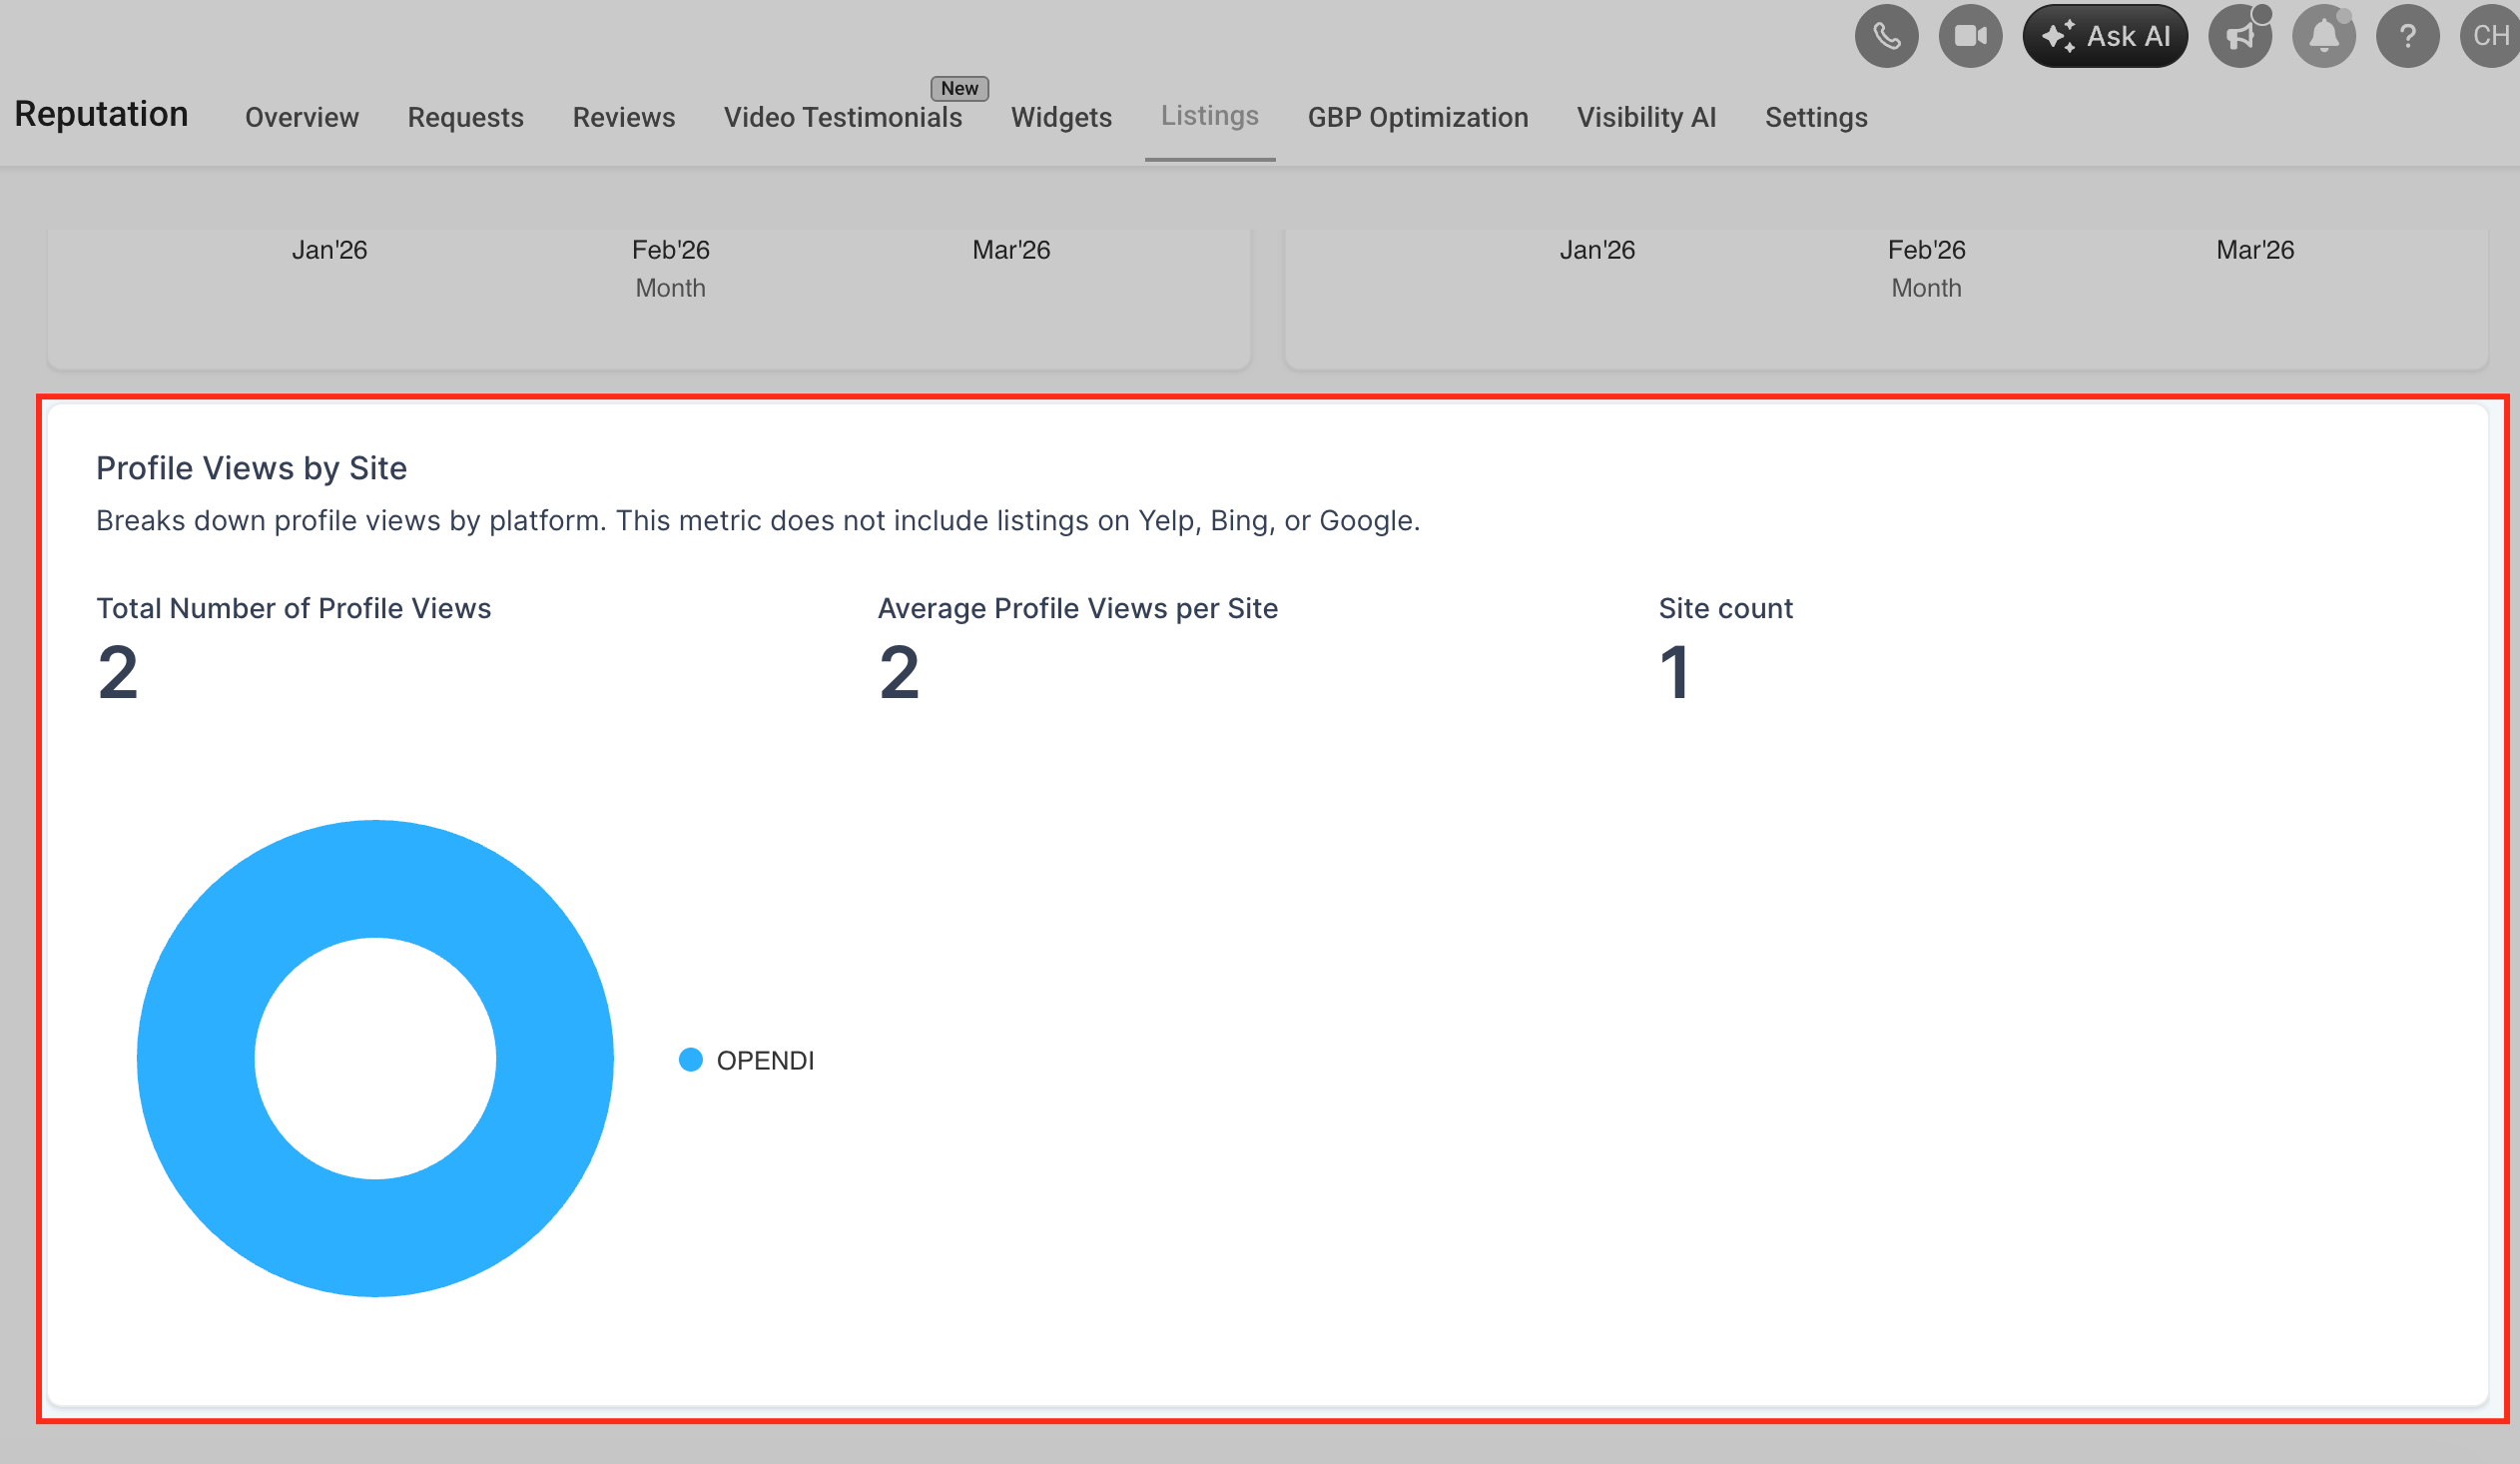
5. Platform Insights
Break down performance by listing platforms to identify:
- High-performing directories
- Underperforming channels
How to Access the Dashboard
Follow these steps to open the Listings Analytics Dashboard:
- Navigate to Listings from the left menu
- Click on the Analytics tab
- Use the date filter to select your desired timeframe
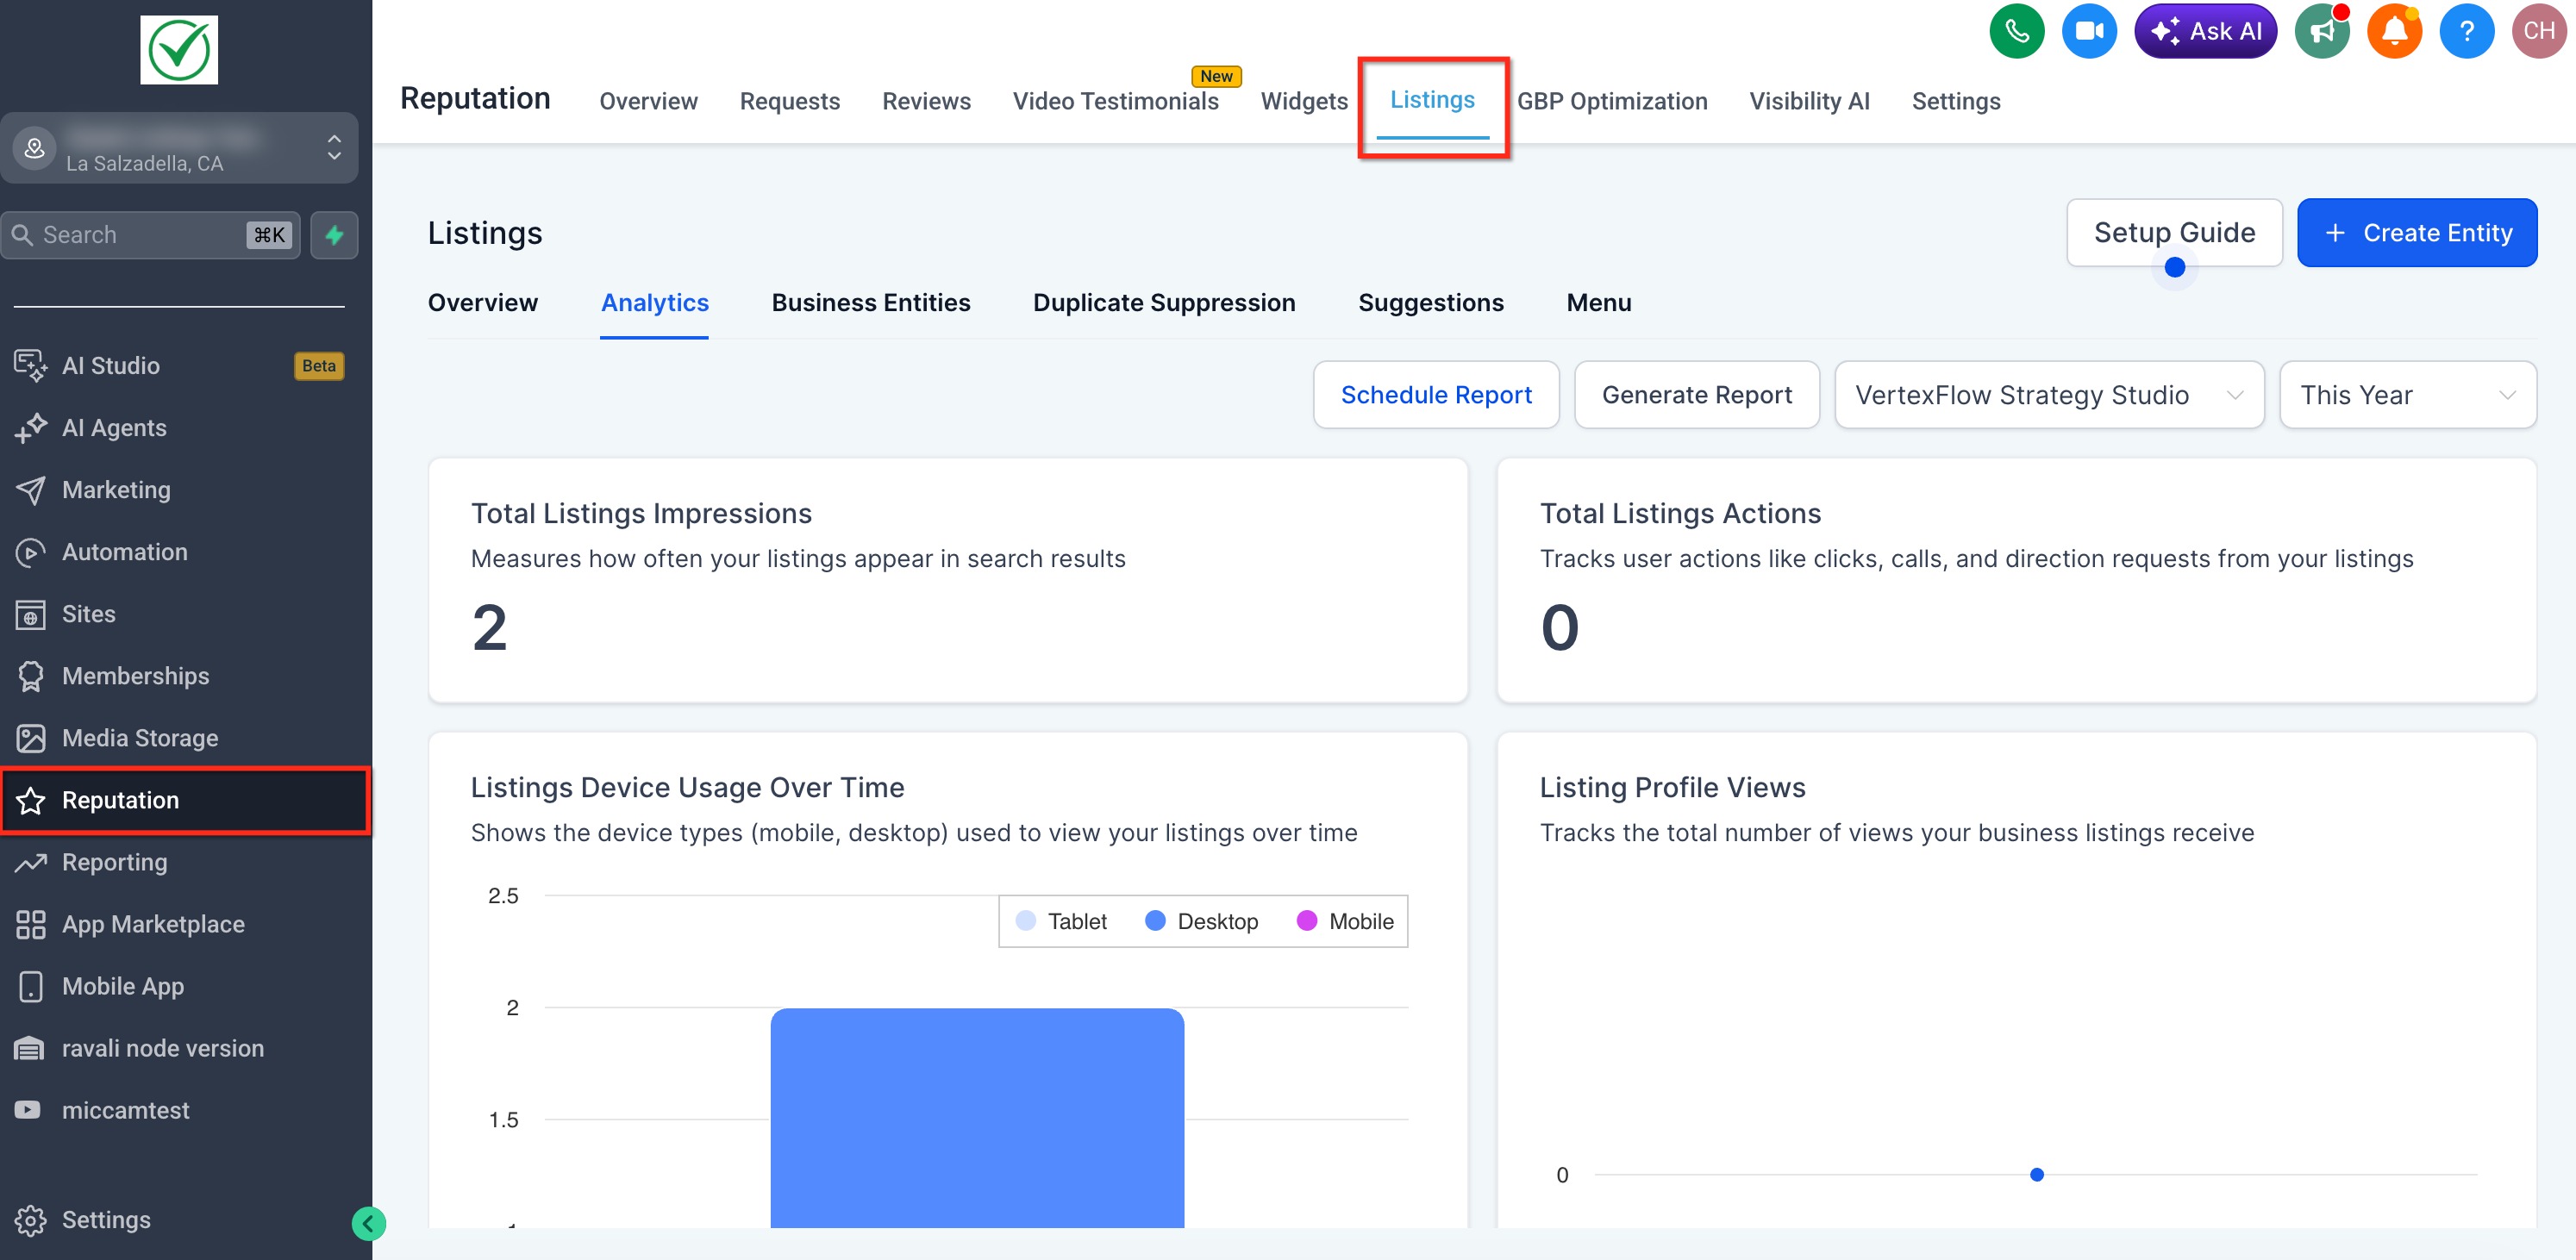
The dashboard will automatically update based on the selected date range.
How to Use the Dashboard Effectively
Identify Trends
Use date filters to compare performance over time and identify:
- Growth patterns
- Seasonal changes
- Drops in engagement
Measure Engagement
Focus on Actions and Profile Views to understand how users interact with your listings.
Optimize Listings Strategy
- Improve listings on platforms with low performance
- Double down on high-performing directories
- Adjust business information if engagement is low
Monitor Device Behavior
If most users are on mobile, ensure:
- Business info is concise
- Click-to-call functionality is optimized
Stay ahead of the competition with deeper insights into your online presence. Explore the new Listings Analytics Dashboard today and unlock new growth opportunities!