
Customizing Dashboard Widgets
Dashboard widgets help you visualize and track important business metrics through charts, graphs, tables, and other data displays. Customizing these widgets allows you to focus on relevant information, compare performance, and present data in a way that supports your reporting goals.
This article explains how to configure dashboard widgets, customize chart types, control trend indicators, apply filters, and save changes.
What Are Dashboard Widgets?
Dashboard widgets display important data using visual elements such as charts, graphs, and tables. They help you monitor metrics, evaluate performance, and understand business activity. You can customize widgets to display relevant metrics, apply filters, adjust chart types, and control how information appears on your dashboard.
Why Should You Customize Dashboard Widgets?
Customizing widgets offers several benefits:
Personalized Insights: Display metrics that align with your business goals.
Enhanced Clarity: Adjust widget titles, layouts, and filters to make data easier to understand.
Improved Comparisons: Compare metrics across different time periods to evaluate performance.
Efficiency: Access the information you need without reviewing unrelated data.
Where to Find the Widget Customization Options
Navigate to your dashboard.
Locate the widget you want to customize.
Open the widget's menu (⋮) and select Edit widget, or enter Edit mode and select the widget.
Use the available configuration options to customize the widget.
How to Customize Dashboard Widgets
Step 1: Choose the Widget
Select the widget you want to customize. Each widget has a default chart type. You can change the chart type using the chart selection options to display the data in a format that suits your reporting requirements.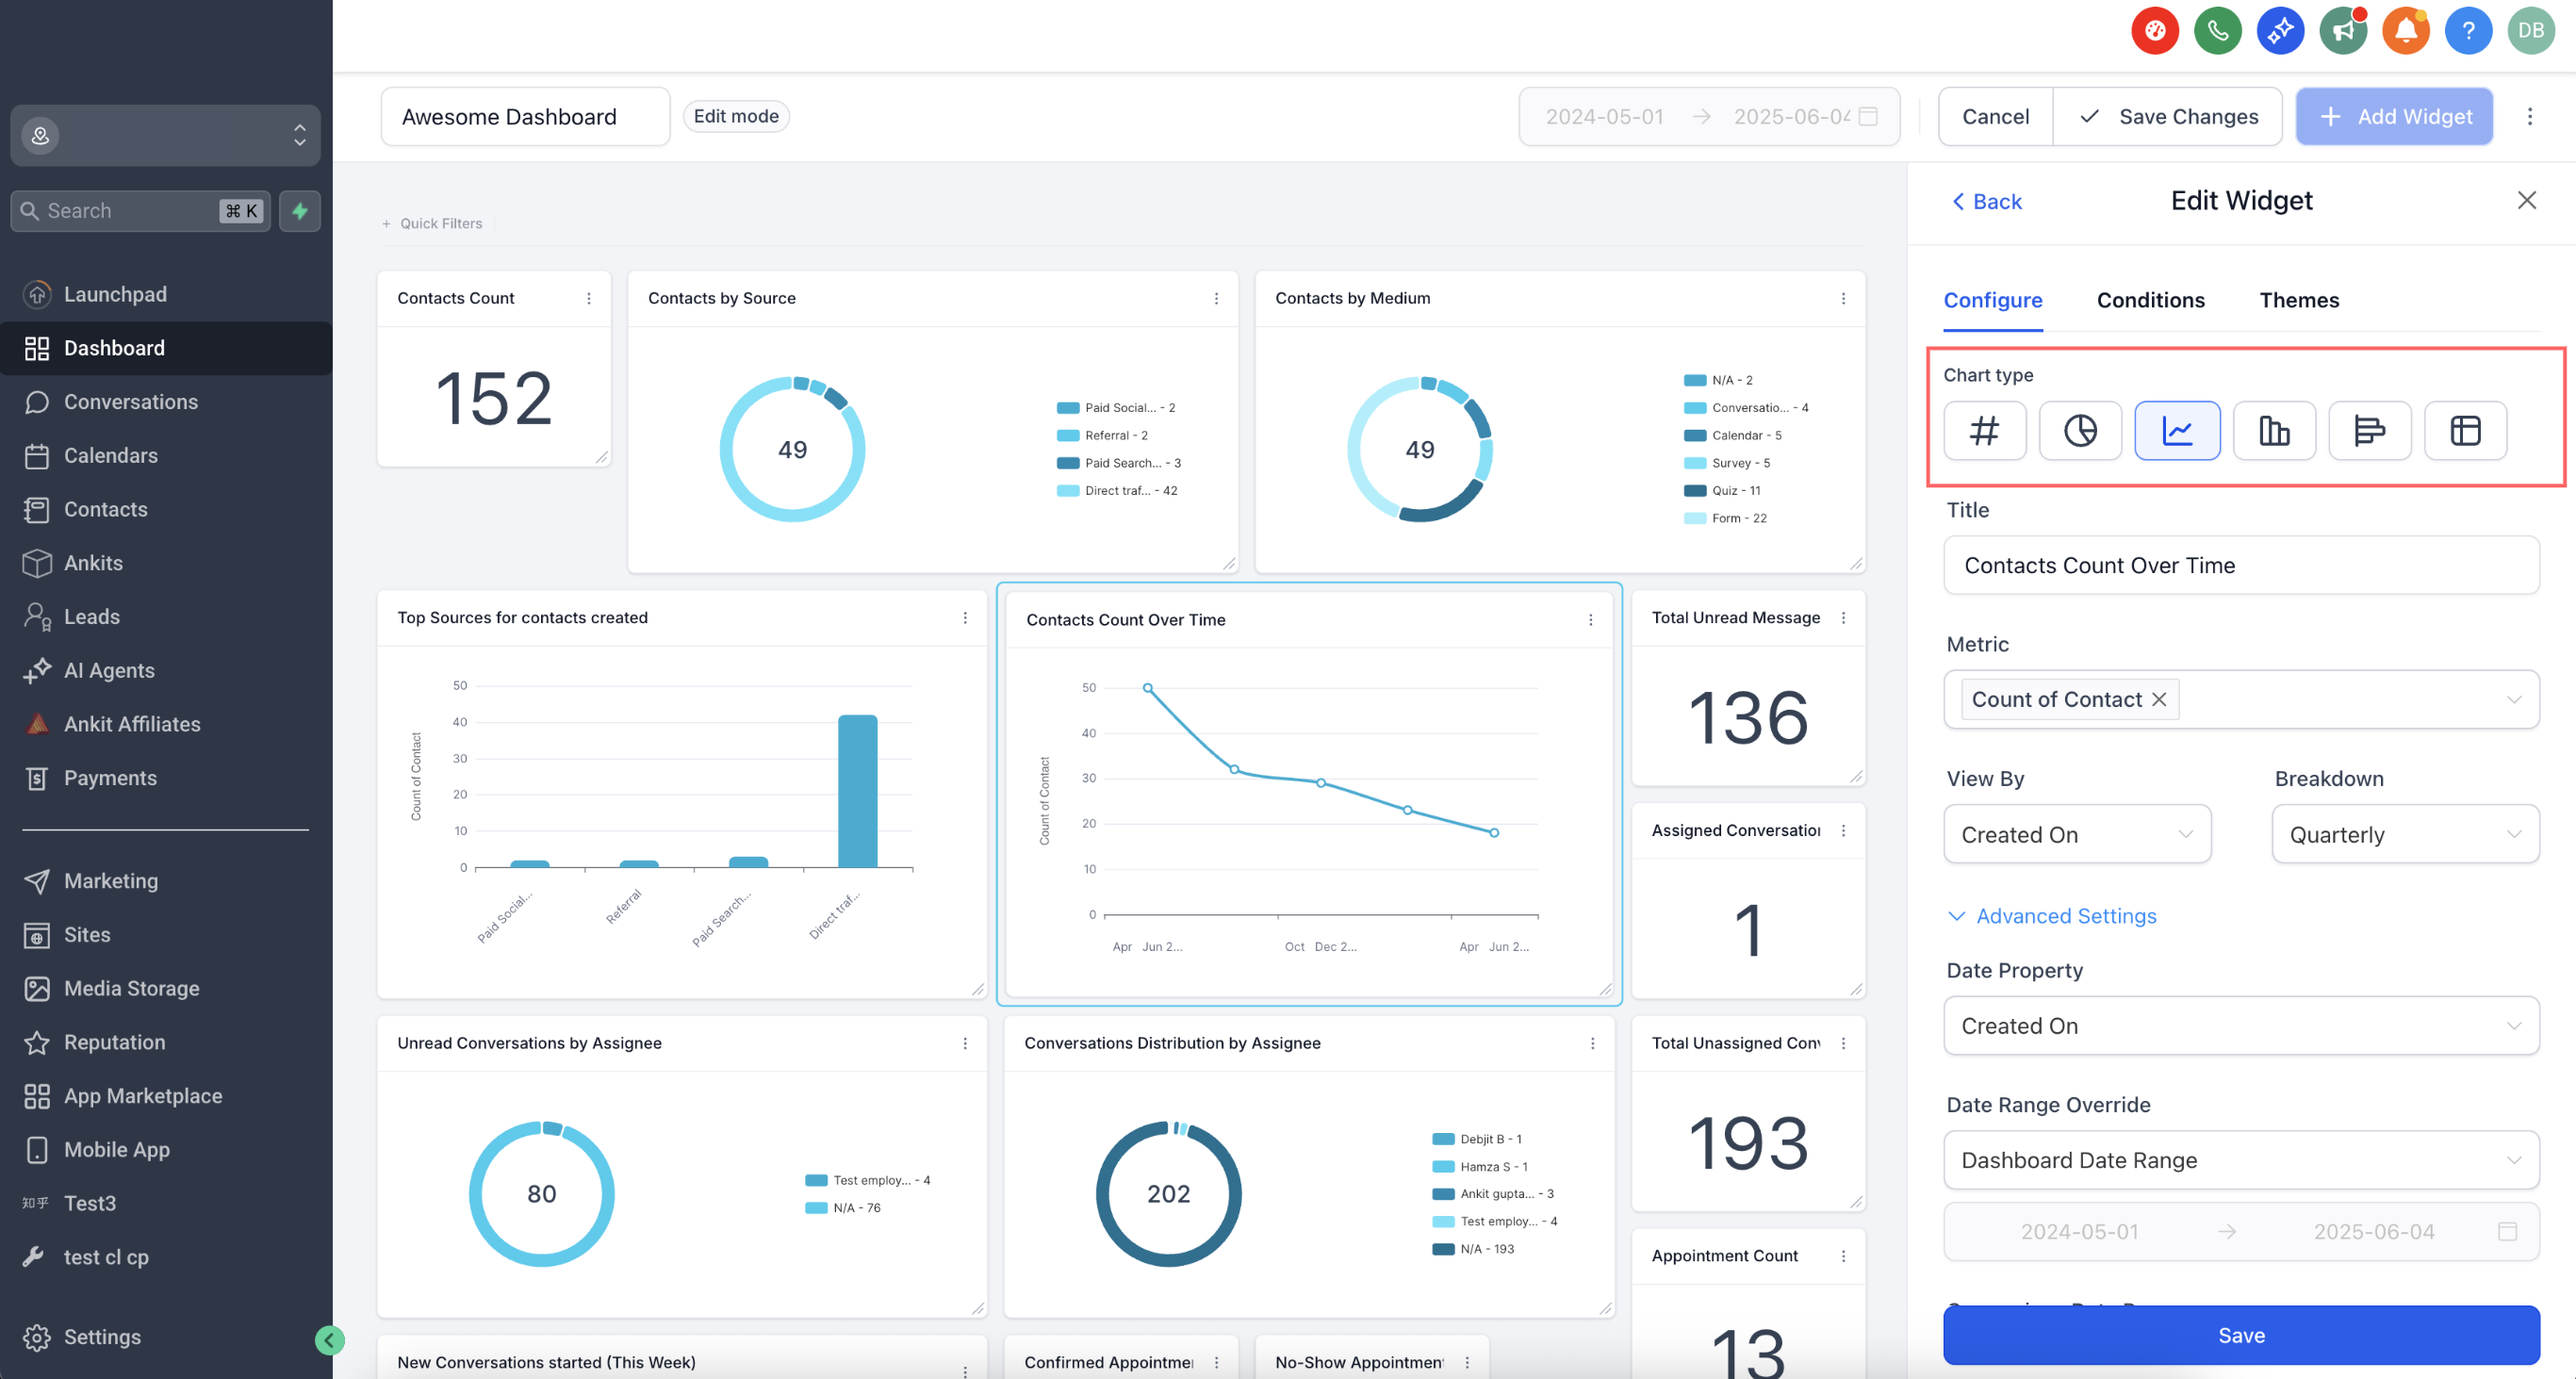
Step 2: Configure the Widget Settings
Open the Configure tab to customize the widget's settings. Depending on the widget type, the available options include:
Title: Rename the widget to describe the information it displays.
Metrics: Select the data points displayed in the widget. Line, Bar, and Horizontal Bar charts support multiple metrics.
Group: Organize data into categories for supported charts, such as Donut charts.
View By: Select a secondary dimension for supported visualizations.
Breakdown: Adjust the frequency used to organize data over time.
Date Property: Choose the date field, such as Created Date or Updated Date, used to retrieve data.
Date Range Override: Set a date range for the widget that differs from the dashboard's global date range.
Order: Sort the displayed results in ascending or descending order.
Limit: Specify the maximum number of results.
Comparison date range: Select a comparison period to display percentage changes between time periods.
You can also expand Advanced settings to access additional customization options, including the trend indicator configuration.
Configure Positive and Negative Trend Indicators
You can specify whether an increase or decrease in a metric represents a positive outcome. This setting controls the color of the widget's trend badge, which displays the percentage change compared to a selected period. By default, an increase appears green and a decrease appears red. However, for metrics such as Bounce Rate, Unsubscribed Emails, or Cost per Lead, a decrease may indicate better performance.
To configure the trend indicator:
Open the dashboard or custom report containing the widget.
Open the widget's menu (⋮) and select Edit widget, or enter Edit mode and select the widget.
Navigate to the Configure tab.
Expand Advanced settings.
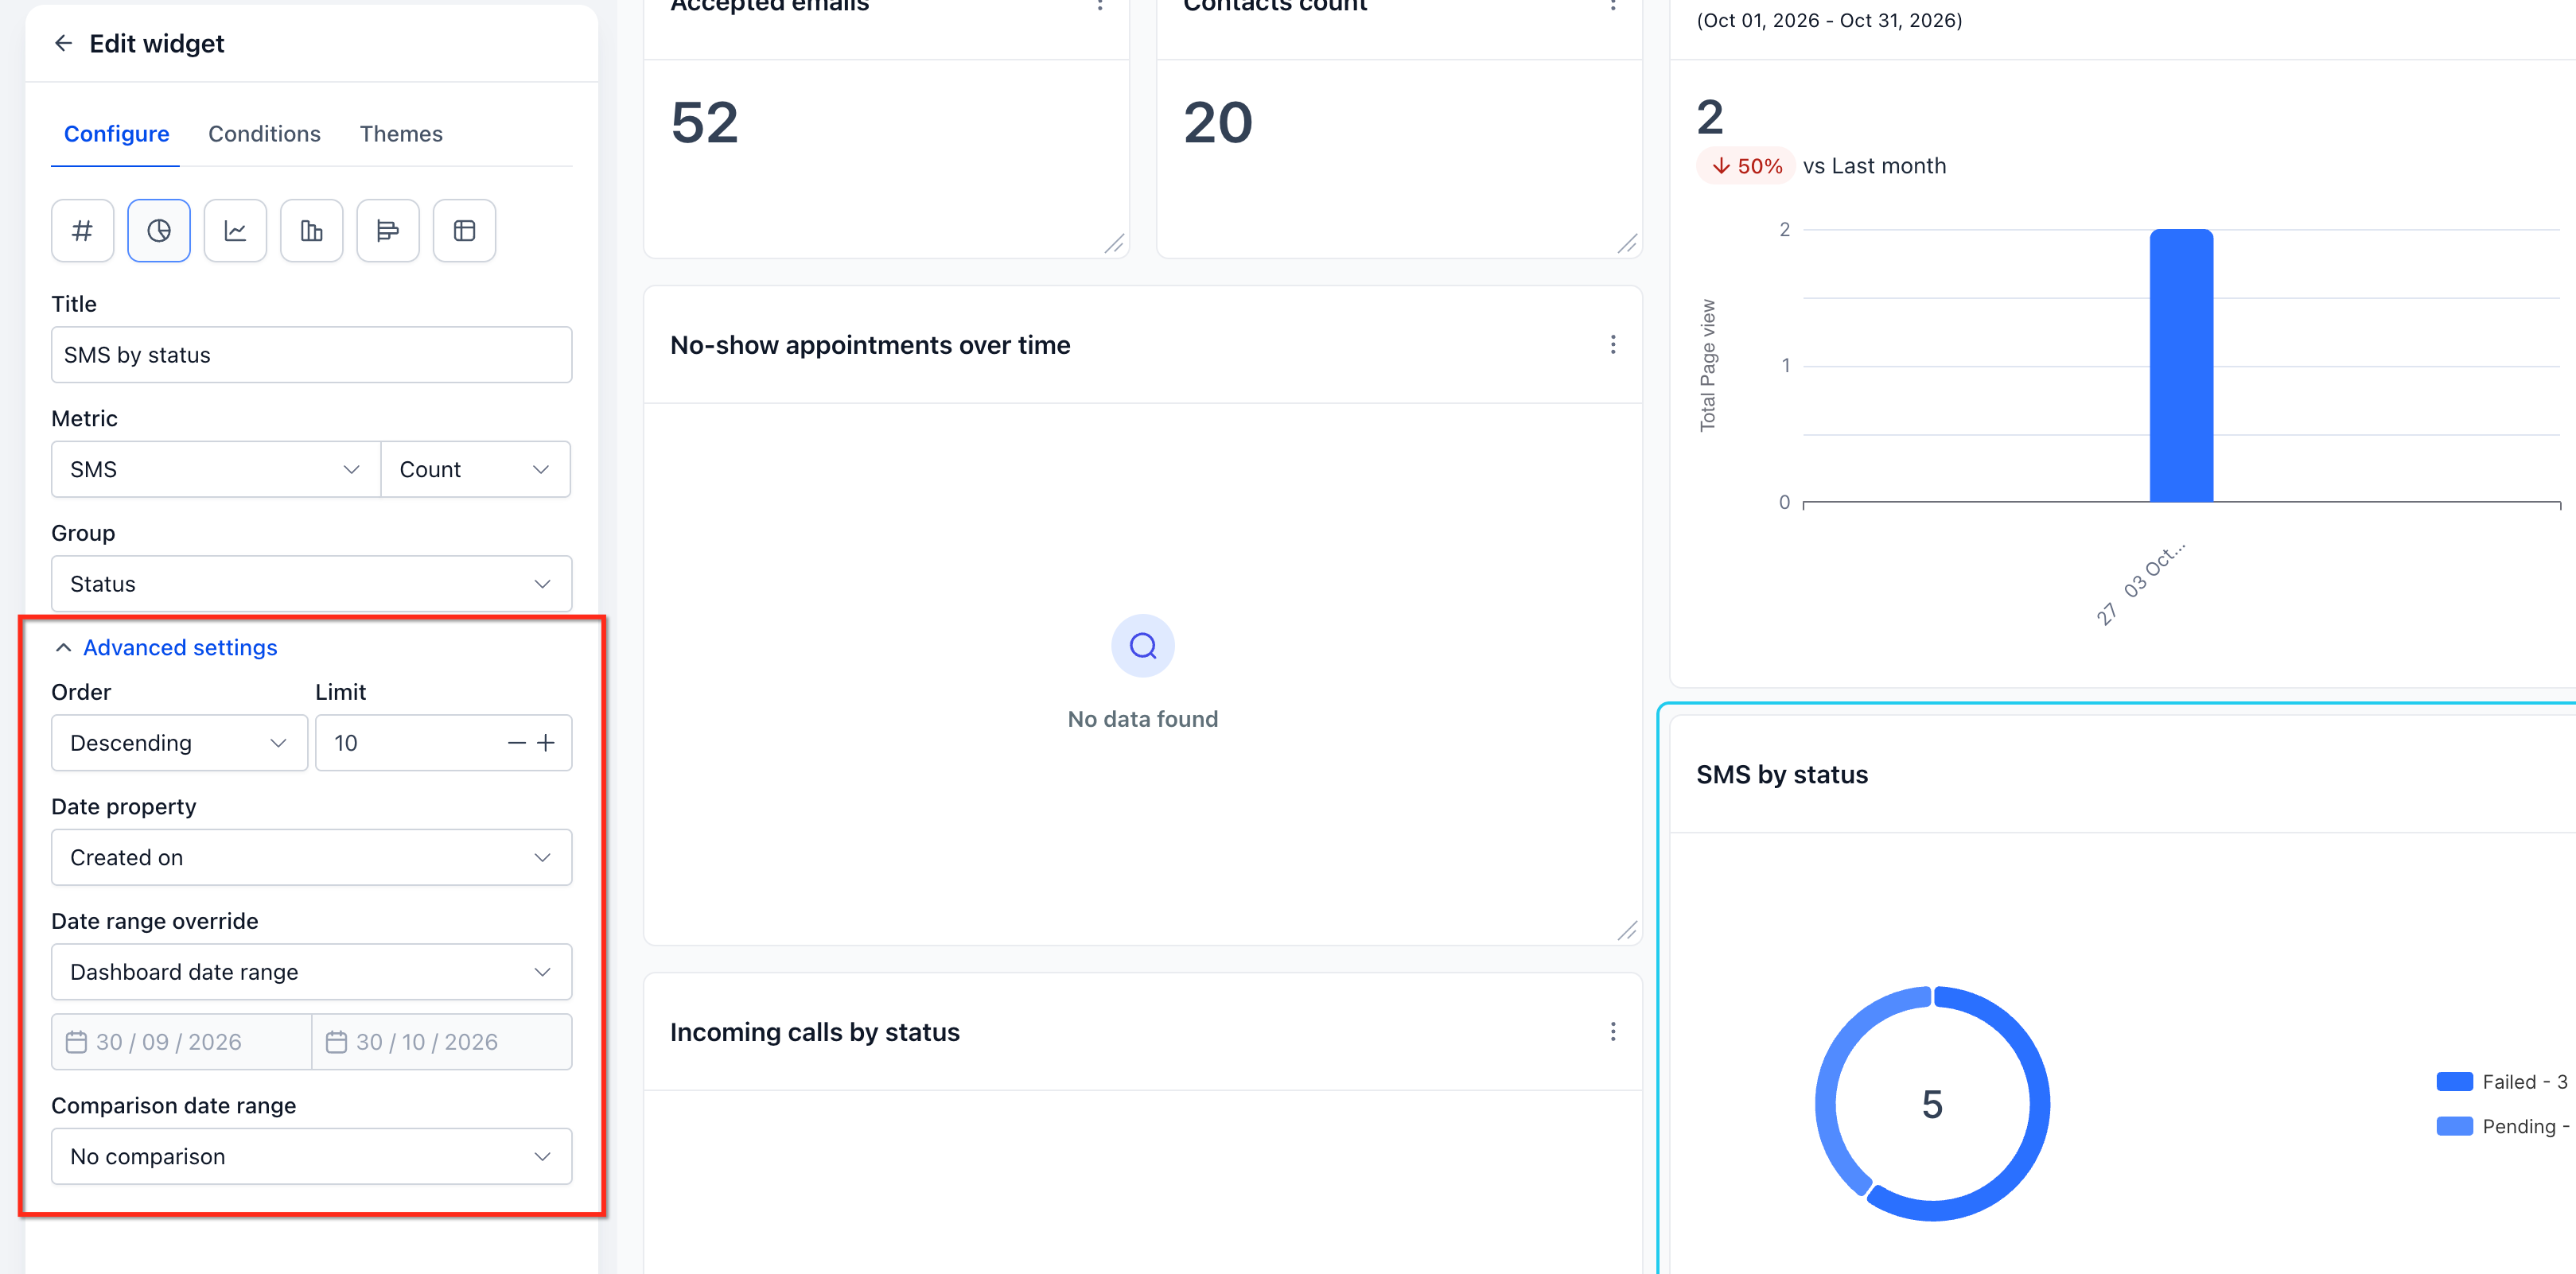
Set a Comparison date range, such as Previous 7 days or Previous period.
Under Specify whether a metric's increase or decrease is positive, choose one of the following:
Increase is positive (default): The trend badge appears green when the metric increases and red when it decreases.
Decrease is positive: The trend badge appears green when the metric decreases and red when it increases.
Click Save changes to apply the setting.
Example:
Consider a widget tracking Bounce Rate.
If Bounce Rate increases, the result is unfavorable.
If Bounce Rate decreases, the result is favorable.
Selecting Decrease is positive ensures that a decrease displays a green trend badge, while an increase displays a red trend badge.
Important Notes:
The setting affects only the trend badge color. It does not change the underlying metric values.
A Comparison date range is required to display the percentage change and trend badge.
The setting works consistently across Number, Line, and Bar chart views of the same widget.
Existing widgets retain Increase is positive as their default setting unless you change it.
Custom metrics have a similar option in the custom metrics builder: When the metric increases, show indicator as → Positive/Negative.
For additional information, see Choosing Whether an Increase or a Decrease Is "Good" for the trend badge.
Chart Type Picker in Widget Settings
You can change the chart type directly within the widget settings to choose a visualization that best represents your data.
To select a chart type:
Open the widget settings and navigate to Configure.
Select the desired chart type, such as Bar, Line, or Pie.
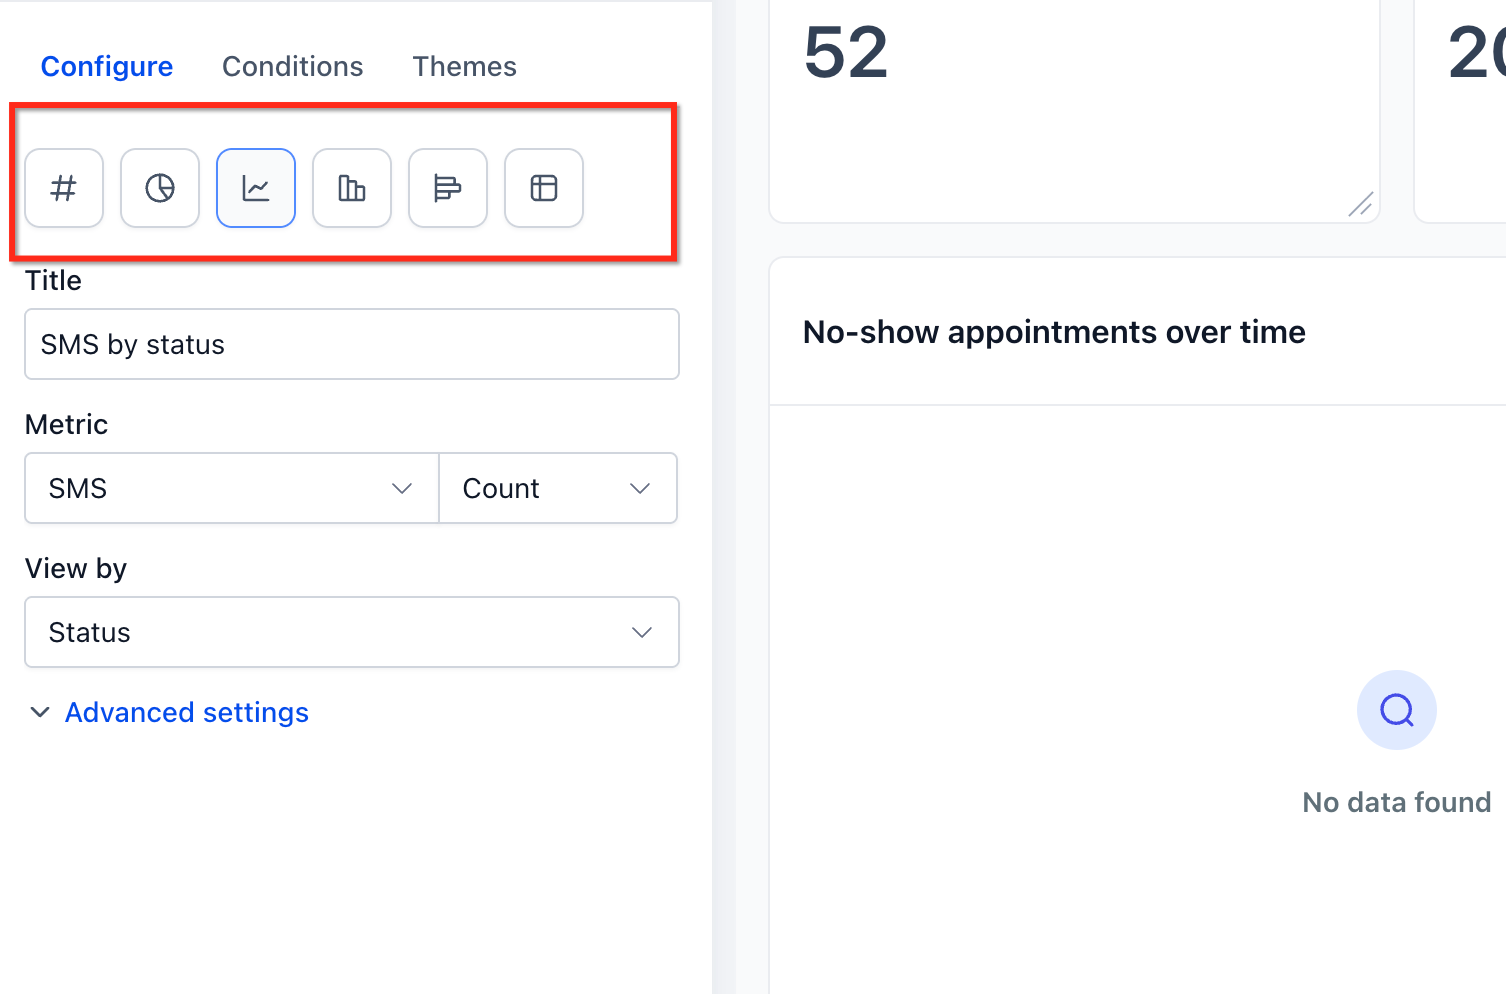
Review the preview to confirm how the data appears.
Continue configuring the widget or save your changes.
Step 3: Add Conditions
Conditions help you control which data appears in a widget. You can apply filters and combine them to create more specific data views.
To add conditions:
Open the widget's Conditions tab.
Click Add Condition.
Choose the field, operator, and required values.
Add additional conditions using the available AND/OR options.
Review the filters and save your changes.
Nested Filter Groups (OR Logic)
Nested filter groups allow you to combine conditions using AND and OR logic. Conditions within the same group use AND logic, while separate groups can use OR logic. To create filter groups:
Open the widget's Conditions tab.
Click Add Filter to create the first group.
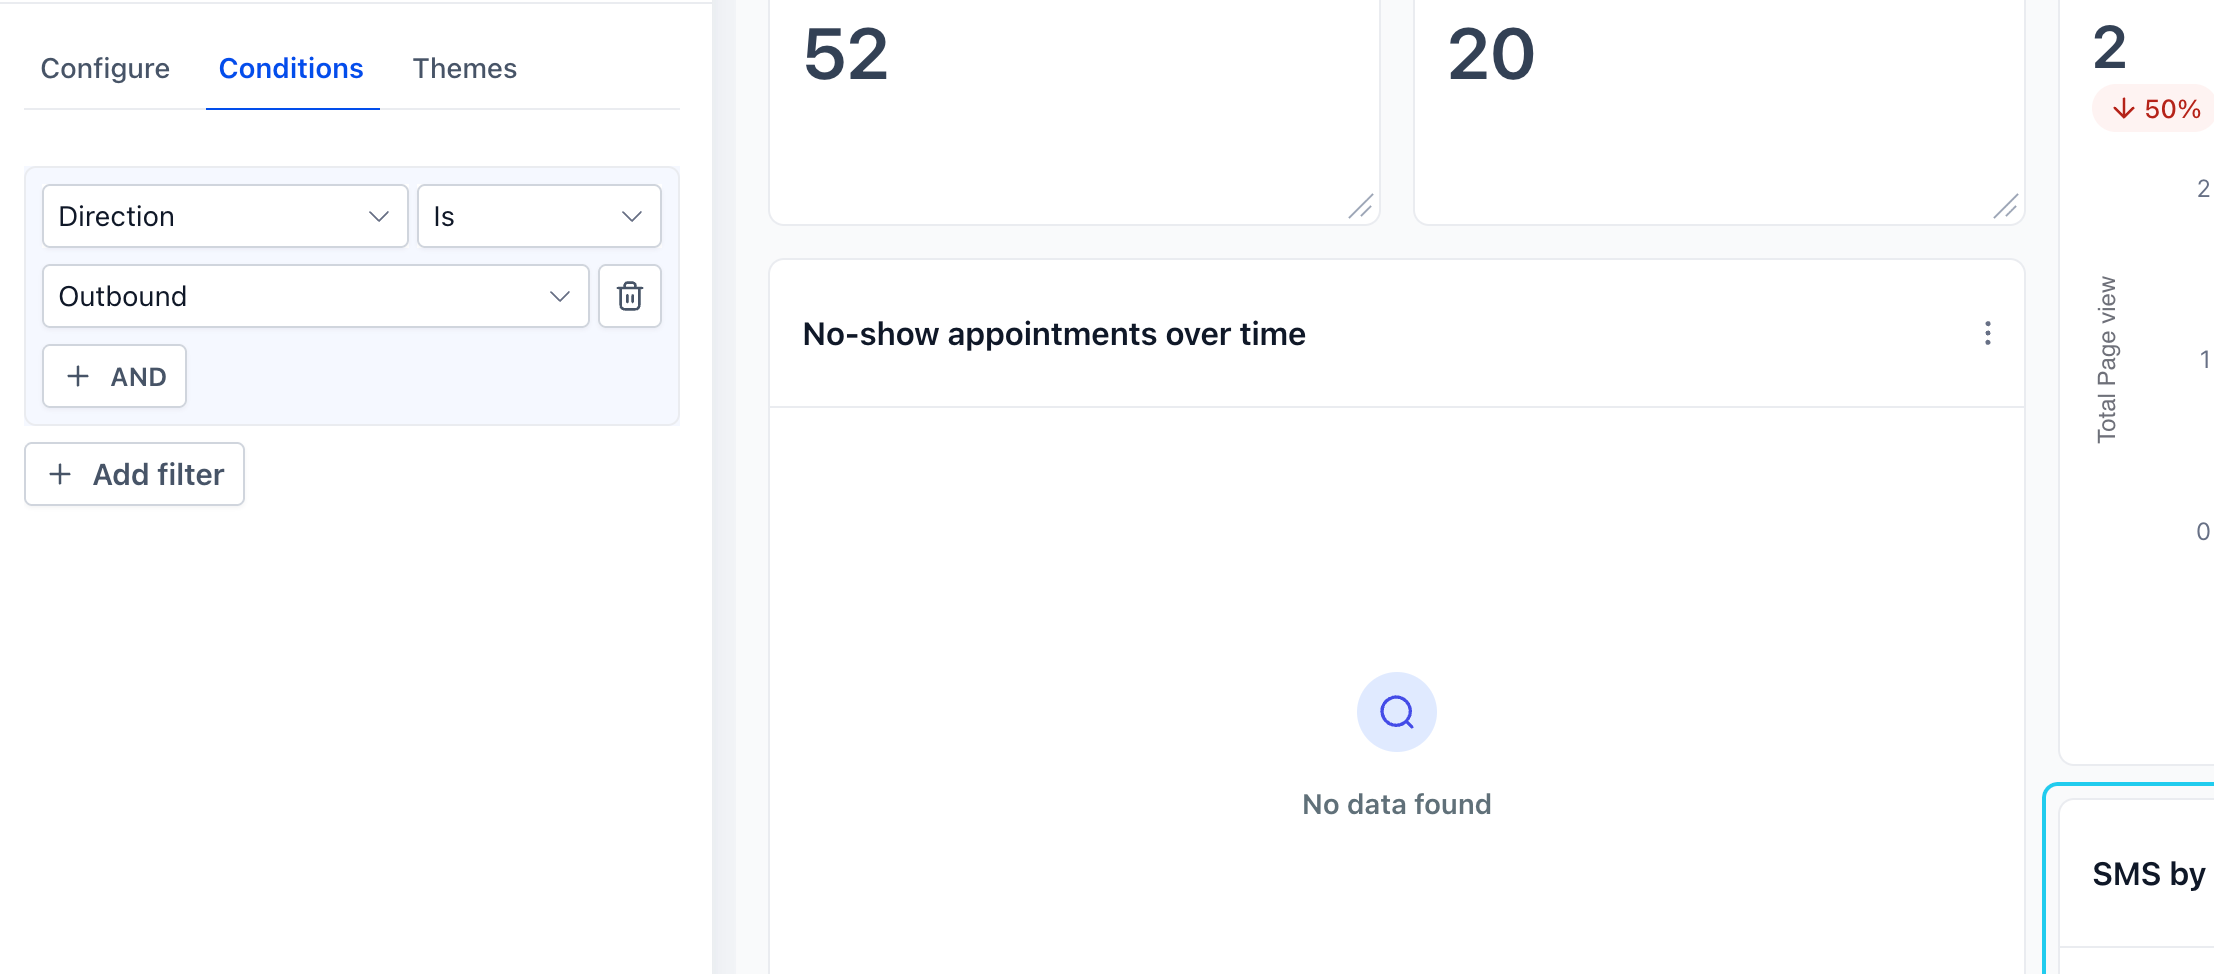
Use +AND to add conditions within that group.
Click +Add Filter to create another group using OR logic.
Add the required conditions and save the widget.
Note: Visitor Data Widgets support only one filter group.
Duplicate Filters via Groups
You can use the same field in separate filter groups to create different matching conditions. For example, to display data from two sources:
Group 1: Source = Google
Group 2: Source = Facebook
Using separate OR groups allows the widget to include records matching either source.
Linked Filter Warnings
Some filters depend on related fields, such as Pipeline and Stage. When you select conflicting values, the widget displays an inline warning in the Conditions tab. To resolve a warning:
Review the highlighted filters.
Adjust the conflicting values.
Confirm that the filter conditions are valid.
Save the widget.
Note: If no data matches the selected conditions, the widget may prevent saving until you adjust or remove the filters.
Step 4: Save Changes
After configuring the widget:
Click Save or Save changes, depending on the widget editing interface.
Adjust the widget's size or position on the dashboard if needed.
Save the dashboard layout to finalize your changes.
Your widget now displays the configured metrics, chart type, filters, and applicable trend indicator settings.